CarsCom CARS full analysis,charts,indicators,moving averages,SMA,DMA,EMA,ADX,MACD,RSICars Com CARS WideScreen charts, DMA,SMA,EMA technical analysis, forecast prediction, by indicators ADX,MACD,RSI,CCI USA stock exchange
operates under Technology sector & deals in EDP Services
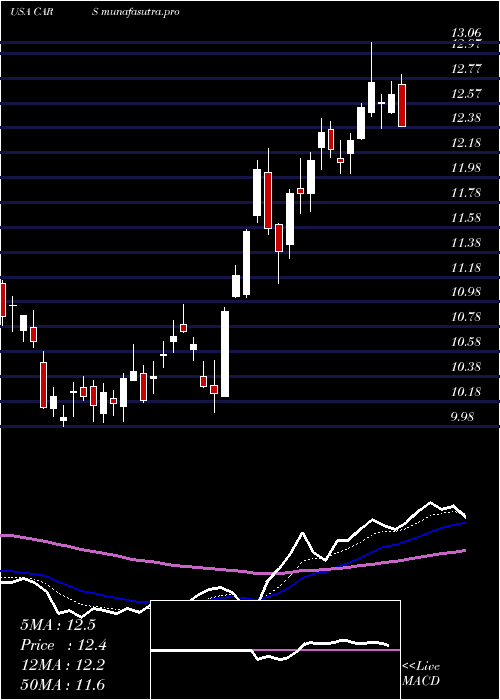
Daily price and charts and targets CarsCom Strong Daily Stock price targets for CarsCom CARS are 11.98 and 12.51 | Daily Target 1 | 11.58 | | Daily Target 2 | 11.85 | | Daily Target 3 | 12.113333333333 | | Daily Target 4 | 12.38 | | Daily Target 5 | 12.64 |
Daily price and volume Cars Com
| Date |
Closing |
Open |
Range |
Volume |
Fri 05 December 2025 |
12.11 (-0.08%) |
11.97 |
11.85 - 12.38 |
1.2661 times |
Thu 04 December 2025 |
12.12 (-2.02%) |
12.37 |
12.02 - 12.40 |
0.6947 times |
Wed 03 December 2025 |
12.37 (3.6%) |
11.92 |
11.80 - 12.42 |
0.8429 times |
Tue 02 December 2025 |
11.94 (0.76%) |
11.91 |
11.66 - 12.16 |
1.0799 times |
Mon 01 December 2025 |
11.85 (2.16%) |
11.47 |
11.47 - 11.87 |
1.6894 times |
Fri 28 November 2025 |
11.60 (-1.02%) |
11.71 |
11.52 - 11.83 |
0.3966 times |
Wed 26 November 2025 |
11.72 (-0.09%) |
11.69 |
11.69 - 11.93 |
1.1703 times |
Tue 25 November 2025 |
11.73 (2.36%) |
11.49 |
11.49 - 11.85 |
0.7277 times |
Mon 24 November 2025 |
11.46 (-0.17%) |
11.44 |
11.38 - 11.60 |
1.0315 times |
Fri 21 November 2025 |
11.48 (6.2%) |
10.92 |
10.90 - 11.55 |
1.1008 times |
Thu 20 November 2025 |
10.81 (-1.28%) |
11.11 |
10.70 - 11.33 |
0.9354 times |
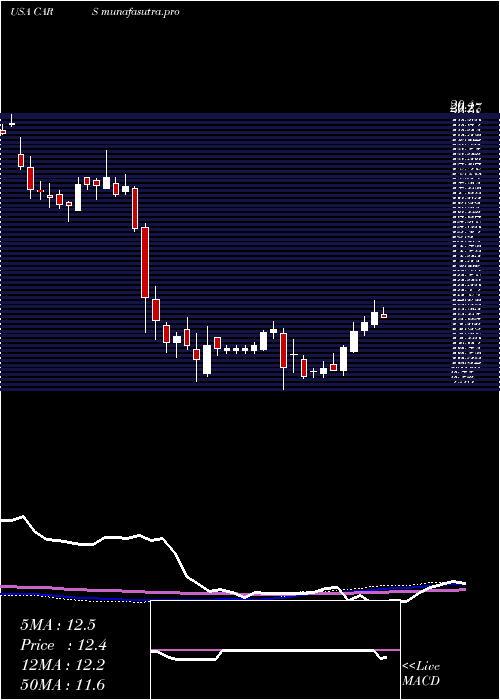
Weekly price and charts CarsCom Strong weekly Stock price targets for CarsCom CARS are 11.79 and 12.74 | Weekly Target 1 | 11.05 | | Weekly Target 2 | 11.58 | | Weekly Target 3 | 12 | | Weekly Target 4 | 12.53 | | Weekly Target 5 | 12.95 |
Weekly price and volumes for Cars Com
| Date |
Closing |
Open |
Range |
Volume |
Fri 05 December 2025 |
12.11 (4.4%) |
11.47 |
11.47 - 12.42 |
1.0569 times |
Fri 28 November 2025 |
11.60 (1.05%) |
11.44 |
11.38 - 11.93 |
0.6308 times |
Fri 21 November 2025 |
11.48 (0.97%) |
11.29 |
10.70 - 11.55 |
1.1964 times |
Fri 14 November 2025 |
11.37 (2.06%) |
11.15 |
11.12 - 11.75 |
1.2384 times |
Fri 07 November 2025 |
11.14 (3.72%) |
10.71 |
10.32 - 12.15 |
1.3389 times |
Fri 31 October 2025 |
10.74 (0%) |
10.68 |
10.63 - 10.84 |
0.1902 times |
Fri 31 October 2025 |
10.74 (-4.96%) |
11.43 |
10.33 - 11.44 |
1.0878 times |
Fri 24 October 2025 |
11.30 (9.18%) |
10.41 |
10.35 - 11.43 |
1.4039 times |
Fri 17 October 2025 |
10.35 (-12.51%) |
10.31 |
10.03 - 10.92 |
1.3378 times |
Tue 07 October 2025 |
11.83 (-4.29%) |
12.43 |
11.82 - 12.70 |
0.519 times |
Fri 03 October 2025 |
12.36 (0.98%) |
12.30 |
11.99 - 12.68 |
1.0522 times |
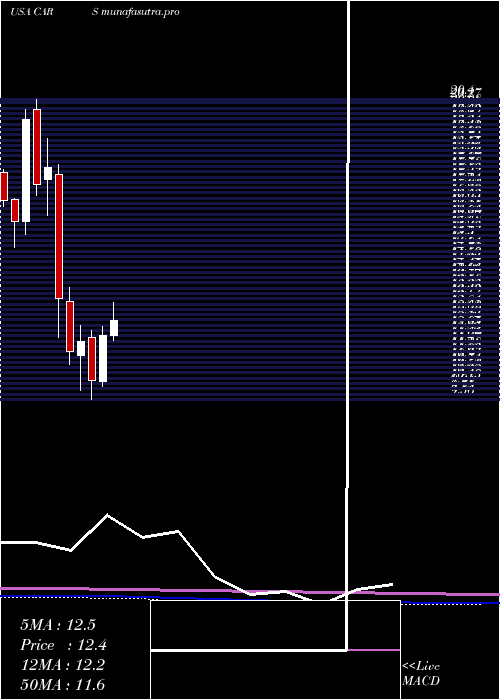
Monthly price and charts CarsCom Strong monthly Stock price targets for CarsCom CARS are 11.79 and 12.74 | Monthly Target 1 | 11.05 | | Monthly Target 2 | 11.58 | | Monthly Target 3 | 12 | | Monthly Target 4 | 12.53 | | Monthly Target 5 | 12.95 |
Monthly price and volumes Cars Com
| Date |
Closing |
Open |
Range |
Volume |
Fri 05 December 2025 |
12.11 (4.4%) |
11.47 |
11.47 - 12.42 |
0.2302 times |
Fri 28 November 2025 |
11.60 (8.01%) |
10.71 |
10.32 - 12.15 |
0.9592 times |
Fri 31 October 2025 |
10.74 (-12.11%) |
12.10 |
10.03 - 12.70 |
1.133 times |
Tue 30 September 2025 |
12.22 (-6.36%) |
12.77 |
11.99 - 13.97 |
0.979 times |
Fri 29 August 2025 |
13.05 (1.4%) |
12.61 |
10.40 - 13.47 |
1.2683 times |
Thu 31 July 2025 |
12.87 (8.61%) |
11.85 |
11.70 - 13.57 |
0.9296 times |
Mon 30 June 2025 |
11.85 (15.61%) |
10.20 |
10.02 - 12.21 |
1.1193 times |
Fri 30 May 2025 |
10.25 (-11.94%) |
11.79 |
9.56 - 12.05 |
1.0946 times |
Wed 30 April 2025 |
11.64 (3.28%) |
11.16 |
9.87 - 12.24 |
1.0751 times |
Mon 31 March 2025 |
11.27 (-14.62%) |
13.11 |
10.80 - 13.61 |
1.2116 times |
Fri 28 February 2025 |
13.20 (-26.34%) |
17.67 |
11.78 - 18.03 |
0.8258 times |
DMA SMA EMA moving averages of Cars Com CARS
DMA (daily moving average) of Cars Com CARS
| DMA period | DMA value | | 5 day DMA | 12.08 | | 12 day DMA | 11.68 | | 20 day DMA | 11.57 | | 35 day DMA | 11.22 | | 50 day DMA | 11.4 | | 100 day DMA | 12.19 | | 150 day DMA | 11.83 | | 200 day DMA | 11.92 | EMA (exponential moving average) of Cars Com CARS
| EMA period | EMA current | EMA prev | EMA prev2 | | 5 day EMA | 12.04 | 12.01 | 11.96 | | 12 day EMA | 11.81 | 11.75 | 11.68 | | 20 day EMA | 11.65 | 11.6 | 11.54 | | 35 day EMA | 11.63 | 11.6 | 11.57 | | 50 day EMA | 11.62 | 11.6 | 11.58 |
SMA (simple moving average) of Cars Com CARS
| SMA period | SMA current | SMA prev | SMA prev2 | | 5 day SMA | 12.08 | 11.98 | 11.9 | | 12 day SMA | 11.68 | 11.61 | 11.54 | | 20 day SMA | 11.57 | 11.52 | 11.43 | | 35 day SMA | 11.22 | 11.17 | 11.13 | | 50 day SMA | 11.4 | 11.41 | 11.44 | | 100 day SMA | 12.19 | 12.19 | 12.2 | | 150 day SMA | 11.83 | 11.83 | 11.83 | | 200 day SMA | 11.92 | 11.95 | 11.98 |
|
|
