CapricorTherapeutics CAPR full analysis,charts,indicators,moving averages,SMA,DMA,EMA,ADX,MACD,RSICapricor Therapeutics CAPR WideScreen charts, DMA,SMA,EMA technical analysis, forecast prediction, by indicators ADX,MACD,RSI,CCI USA stock exchange
operates under Health Care sector & deals in Major Pharmaceuticals
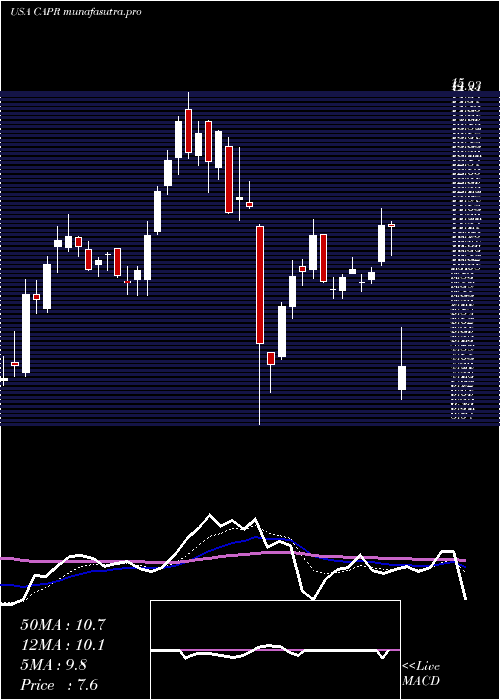
Daily price and charts and targets CapricorTherapeutics Strong Daily Stock price targets for CapricorTherapeutics CAPR are 6.35 and 6.61 | Daily Target 1 | 6.16 | | Daily Target 2 | 6.28 | | Daily Target 3 | 6.42 | | Daily Target 4 | 6.54 | | Daily Target 5 | 6.68 |
Daily price and volume Capricor Therapeutics
| Date |
Closing |
Open |
Range |
Volume |
Mon 20 October 2025 |
6.40 (2.4%) |
6.33 |
6.30 - 6.56 |
0.8804 times |
Fri 17 October 2025 |
6.25 (-0.64%) |
6.15 |
6.01 - 6.54 |
1.2907 times |
Thu 16 October 2025 |
6.29 (-5.98%) |
6.76 |
6.10 - 6.82 |
1.152 times |
Wed 15 October 2025 |
6.69 (-0.15%) |
6.72 |
6.62 - 6.89 |
0.9606 times |
Tue 14 October 2025 |
6.70 (-0.3%) |
6.62 |
6.46 - 6.80 |
0.9336 times |
Mon 13 October 2025 |
6.72 (-5.22%) |
7.13 |
6.70 - 7.16 |
1.3425 times |
Fri 10 October 2025 |
7.09 (-6.96%) |
7.62 |
7.06 - 7.62 |
1.0797 times |
Thu 09 October 2025 |
7.62 (1.87%) |
7.51 |
7.47 - 7.82 |
0.8791 times |
Wed 08 October 2025 |
7.48 (-0.27%) |
7.53 |
7.46 - 7.71 |
0.6997 times |
Tue 07 October 2025 |
7.50 (-4.21%) |
7.80 |
7.44 - 7.80 |
0.7817 times |
Mon 06 October 2025 |
7.83 (5.24%) |
7.45 |
7.23 - 7.90 |
0.9898 times |
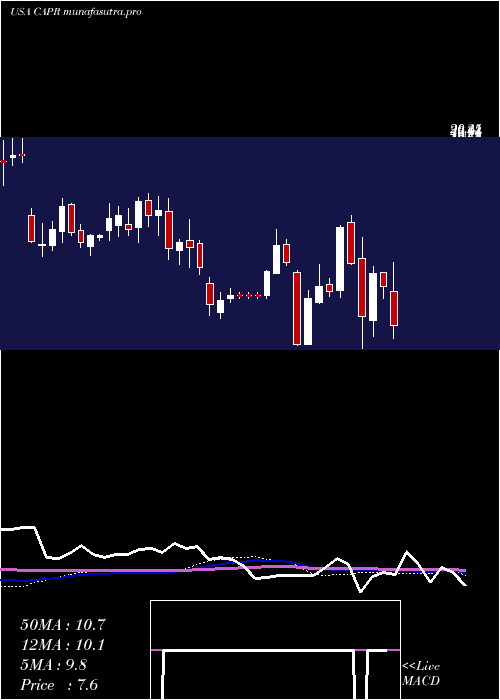
Weekly price and charts CapricorTherapeutics Strong weekly Stock price targets for CapricorTherapeutics CAPR are 6.35 and 6.61 | Weekly Target 1 | 6.16 | | Weekly Target 2 | 6.28 | | Weekly Target 3 | 6.42 | | Weekly Target 4 | 6.54 | | Weekly Target 5 | 6.68 |
Weekly price and volumes for Capricor Therapeutics
| Date |
Closing |
Open |
Range |
Volume |
Mon 20 October 2025 |
6.40 (2.4%) |
6.33 |
6.30 - 6.56 |
0.1664 times |
Fri 17 October 2025 |
6.25 (-11.85%) |
7.13 |
6.01 - 7.16 |
1.0733 times |
Fri 10 October 2025 |
7.09 (-4.7%) |
7.45 |
7.06 - 7.90 |
0.8372 times |
Fri 03 October 2025 |
7.44 (4.94%) |
7.21 |
7.11 - 8.06 |
1.2758 times |
Fri 26 September 2025 |
7.09 (6.62%) |
6.60 |
6.05 - 7.33 |
2.1903 times |
Fri 19 September 2025 |
6.65 (4.56%) |
6.43 |
5.97 - 6.67 |
1.0605 times |
Fri 12 September 2025 |
6.36 (-5.64%) |
6.68 |
6.05 - 6.77 |
0.702 times |
Fri 05 September 2025 |
6.74 (7.32%) |
6.26 |
5.68 - 6.77 |
1.1635 times |
Fri 29 August 2025 |
6.28 (0%) |
6.28 |
6.18 - 6.36 |
0.1545 times |
Fri 29 August 2025 |
6.28 (-11.55%) |
7.10 |
6.17 - 7.10 |
1.3765 times |
Fri 22 August 2025 |
7.10 (-10.8%) |
7.97 |
6.90 - 8.00 |
1.2403 times |
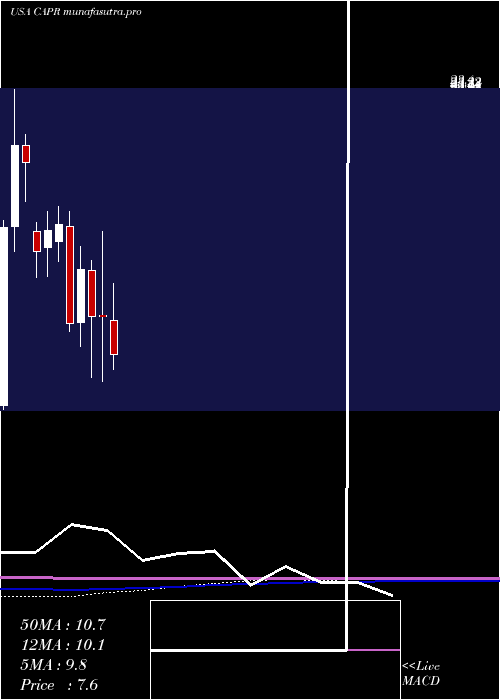
Monthly price and charts CapricorTherapeutics Strong monthly Stock price targets for CapricorTherapeutics CAPR are 5.18 and 7.23 | Monthly Target 1 | 4.77 | | Monthly Target 2 | 5.59 | | Monthly Target 3 | 6.8233333333333 | | Monthly Target 4 | 7.64 | | Monthly Target 5 | 8.87 |
Monthly price and volumes Capricor Therapeutics
| Date |
Closing |
Open |
Range |
Volume |
Mon 20 October 2025 |
6.40 (-11.23%) |
7.21 |
6.01 - 8.06 |
0.4046 times |
Tue 30 September 2025 |
7.21 (14.81%) |
6.26 |
5.68 - 7.64 |
0.8043 times |
Fri 29 August 2025 |
6.28 (-23.23%) |
7.93 |
6.17 - 9.43 |
0.8059 times |
Thu 31 July 2025 |
8.18 (-17.62%) |
9.69 |
6.19 - 11.88 |
1.7104 times |
Mon 30 June 2025 |
9.93 (0.4%) |
9.97 |
6.07 - 15.00 |
1.7819 times |
Fri 30 May 2025 |
9.89 (-22.13%) |
12.65 |
6.27 - 13.22 |
1.8525 times |
Wed 30 April 2025 |
12.70 (33.83%) |
9.56 |
8.11 - 14.08 |
0.7237 times |
Mon 31 March 2025 |
9.49 (-38.3%) |
15.27 |
9.01 - 16.17 |
0.8643 times |
Fri 28 February 2025 |
15.38 (2.26%) |
14.39 |
13.20 - 16.47 |
0.5731 times |
Fri 31 January 2025 |
15.04 (8.99%) |
14.02 |
12.31 - 16.17 |
0.4793 times |
Tue 31 December 2024 |
13.80 (-27.6%) |
15.00 |
12.25 - 15.48 |
0.5238 times |
DMA SMA EMA moving averages of Capricor Therapeutics CAPR
DMA (daily moving average) of Capricor Therapeutics CAPR
| DMA period | DMA value | | 5 day DMA | 6.47 | | 12 day DMA | 7 | | 20 day DMA | 7.02 | | 35 day DMA | 6.72 | | 50 day DMA | 6.84 | | 100 day DMA | 8.18 | | 150 day DMA | 8.91 | | 200 day DMA | 10.22 | EMA (exponential moving average) of Capricor Therapeutics CAPR
| EMA period | EMA current | EMA prev | EMA prev2 | | 5 day EMA | 6.5 | 6.55 | 6.7 | | 12 day EMA | 6.76 | 6.83 | 6.94 | | 20 day EMA | 6.84 | 6.89 | 6.96 | | 35 day EMA | 6.97 | 7 | 7.04 | | 50 day EMA | 6.9 | 6.92 | 6.95 |
SMA (simple moving average) of Capricor Therapeutics CAPR
| SMA period | SMA current | SMA prev | SMA prev2 | | 5 day SMA | 6.47 | 6.53 | 6.7 | | 12 day SMA | 7 | 7.13 | 7.26 | | 20 day SMA | 7.02 | 7 | 7.02 | | 35 day SMA | 6.72 | 6.71 | 6.71 | | 50 day SMA | 6.84 | 6.87 | 6.92 | | 100 day SMA | 8.18 | 8.22 | 8.26 | | 150 day SMA | 8.91 | 8.95 | 8.99 | | 200 day SMA | 10.22 | 10.26 | 10.3 |
|
|
