CalMaine CALM full analysis,charts,indicators,moving averages,SMA,DMA,EMA,ADX,MACD,RSICal Maine CALM WideScreen charts, DMA,SMA,EMA technical analysis, forecast prediction, by indicators ADX,MACD,RSI,CCI USA stock exchange
operates under Consumer Non Durables sector & deals in Farming Seeds Milling
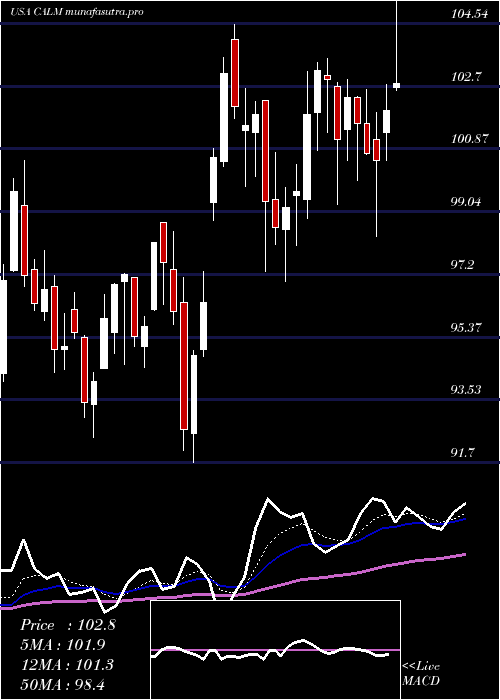
Daily price and charts and targets CalMaine Strong Daily Stock price targets for CalMaine CALM are 88.95 and 93.4 | Daily Target 1 | 88.19 | | Daily Target 2 | 89.71 | | Daily Target 3 | 92.64 | | Daily Target 4 | 94.16 | | Daily Target 5 | 97.09 |
Daily price and volume Cal Maine
| Date |
Closing |
Open |
Range |
Volume |
Mon 20 October 2025 |
91.23 (-3.52%) |
94.97 |
91.12 - 95.57 |
0.5399 times |
Fri 17 October 2025 |
94.56 (2.94%) |
92.29 |
92.29 - 94.71 |
0.6841 times |
Thu 16 October 2025 |
91.86 (-1.28%) |
93.05 |
91.80 - 93.47 |
0.9892 times |
Wed 15 October 2025 |
93.05 (-0.23%) |
93.73 |
92.34 - 94.54 |
0.7723 times |
Tue 14 October 2025 |
93.26 (1.34%) |
91.86 |
91.80 - 94.03 |
0.8183 times |
Mon 13 October 2025 |
92.03 (-2.54%) |
94.54 |
91.94 - 95.56 |
1.2674 times |
Fri 10 October 2025 |
94.43 (3.15%) |
92.36 |
91.50 - 94.77 |
1.3073 times |
Thu 09 October 2025 |
91.55 (-0.62%) |
92.12 |
91.50 - 93.14 |
0.8602 times |
Wed 08 October 2025 |
92.12 (-0.81%) |
93.01 |
91.49 - 93.12 |
1.5082 times |
Tue 07 October 2025 |
92.87 (-0.67%) |
94.60 |
92.25 - 94.60 |
1.2531 times |
Mon 06 October 2025 |
93.50 (1.02%) |
92.56 |
92.00 - 94.12 |
0.992 times |
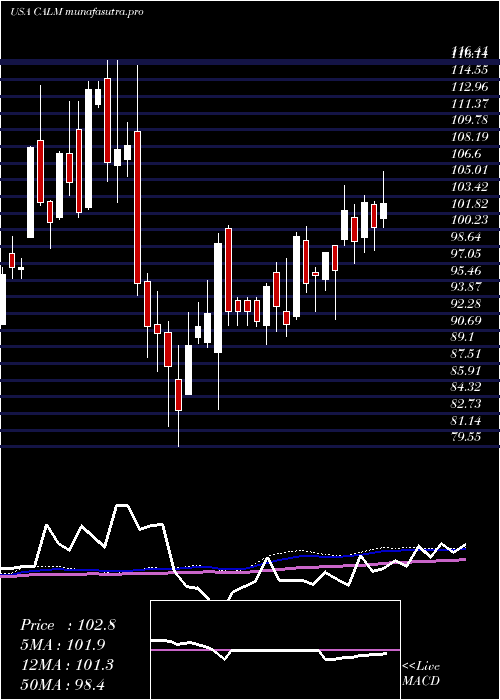
Weekly price and charts CalMaine Strong weekly Stock price targets for CalMaine CALM are 88.95 and 93.4 | Weekly Target 1 | 88.19 | | Weekly Target 2 | 89.71 | | Weekly Target 3 | 92.64 | | Weekly Target 4 | 94.16 | | Weekly Target 5 | 97.09 |
Weekly price and volumes for Cal Maine
| Date |
Closing |
Open |
Range |
Volume |
Mon 20 October 2025 |
91.23 (-3.52%) |
94.97 |
91.12 - 95.57 |
0.1327 times |
Fri 17 October 2025 |
94.56 (0.14%) |
94.54 |
91.80 - 95.56 |
1.1136 times |
Fri 10 October 2025 |
94.43 (2.02%) |
92.56 |
91.49 - 94.77 |
1.4551 times |
Fri 03 October 2025 |
92.56 (-5.96%) |
98.44 |
86.64 - 98.44 |
2.0773 times |
Fri 26 September 2025 |
98.43 (-1.57%) |
99.95 |
94.50 - 101.86 |
1.5812 times |
Fri 19 September 2025 |
100.00 (-9.62%) |
110.56 |
99.50 - 110.87 |
1.309 times |
Fri 12 September 2025 |
110.64 (-2.8%) |
114.18 |
106.32 - 115.28 |
0.7239 times |
Fri 05 September 2025 |
113.83 (-1.57%) |
115.64 |
109.92 - 116.58 |
0.7754 times |
Fri 29 August 2025 |
115.64 (0%) |
115.87 |
115.28 - 116.61 |
0.1366 times |
Fri 29 August 2025 |
115.64 (-0.34%) |
116.33 |
113.17 - 117.45 |
0.6953 times |
Fri 22 August 2025 |
116.04 (4.87%) |
111.00 |
108.70 - 116.63 |
0.9125 times |
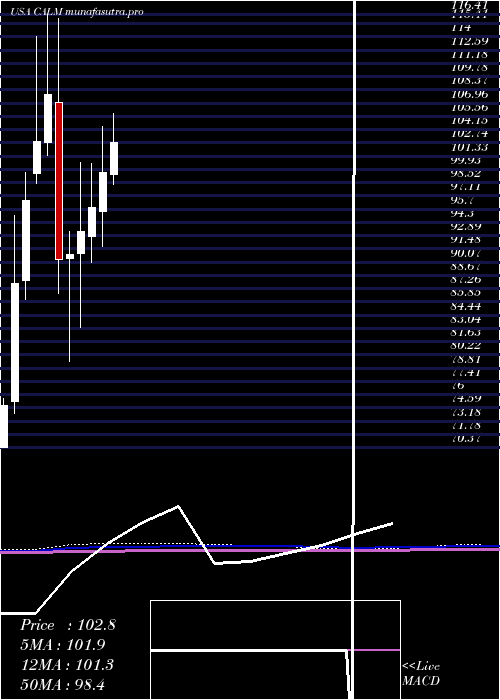
Monthly price and charts CalMaine Strong monthly Stock price targets for CalMaine CALM are 88.94 and 97.87 | Monthly Target 1 | 82.22 | | Monthly Target 2 | 86.72 | | Monthly Target 3 | 91.146666666667 | | Monthly Target 4 | 95.65 | | Monthly Target 5 | 100.08 |
Monthly price and volumes Cal Maine
| Date |
Closing |
Open |
Range |
Volume |
Mon 20 October 2025 |
91.23 (-3.05%) |
87.00 |
86.64 - 95.57 |
0.8479 times |
Tue 30 September 2025 |
94.10 (-18.63%) |
115.64 |
93.75 - 116.58 |
1.0828 times |
Fri 29 August 2025 |
115.64 (4.05%) |
110.11 |
103.42 - 117.45 |
0.7699 times |
Thu 31 July 2025 |
111.14 (11.55%) |
99.38 |
98.31 - 126.40 |
1.1765 times |
Mon 30 June 2025 |
99.63 (3.86%) |
95.51 |
91.70 - 104.49 |
0.7792 times |
Fri 30 May 2025 |
95.93 (2.74%) |
92.84 |
90.07 - 100.54 |
0.8975 times |
Wed 30 April 2025 |
93.37 (2.72%) |
91.04 |
83.11 - 100.67 |
1.3571 times |
Mon 31 March 2025 |
90.90 (0.56%) |
90.46 |
79.55 - 93.30 |
0.9806 times |
Fri 28 February 2025 |
90.39 (-16.23%) |
107.00 |
86.71 - 115.94 |
1.1056 times |
Fri 31 January 2025 |
107.90 (4.84%) |
102.80 |
101.46 - 116.41 |
1.003 times |
Tue 31 December 2024 |
102.92 (6.52%) |
99.51 |
98.45 - 114.06 |
0.5431 times |
DMA SMA EMA moving averages of Cal Maine CALM
DMA (daily moving average) of Cal Maine CALM
| DMA period | DMA value | | 5 day DMA | 92.79 | | 12 day DMA | 92.75 | | 20 day DMA | 93.96 | | 35 day DMA | 100.09 | | 50 day DMA | 103.91 | | 100 day DMA | 102.96 | | 150 day DMA | 99.74 | | 200 day DMA | 100.09 | EMA (exponential moving average) of Cal Maine CALM
| EMA period | EMA current | EMA prev | EMA prev2 | | 5 day EMA | 92.58 | 93.26 | 92.61 | | 12 day EMA | 93.4 | 93.8 | 93.66 | | 20 day EMA | 95.15 | 95.56 | 95.67 | | 35 day EMA | 98.75 | 99.19 | 99.46 | | 50 day EMA | 102.98 | 103.46 | 103.82 |
SMA (simple moving average) of Cal Maine CALM
| SMA period | SMA current | SMA prev | SMA prev2 | | 5 day SMA | 92.79 | 92.95 | 92.93 | | 12 day SMA | 92.75 | 92.9 | 92.77 | | 20 day SMA | 93.96 | 94.37 | 94.64 | | 35 day SMA | 100.09 | 100.78 | 101.39 | | 50 day SMA | 103.91 | 104.24 | 104.5 | | 100 day SMA | 102.96 | 103 | 103.01 | | 150 day SMA | 99.74 | 99.67 | 99.61 | | 200 day SMA | 100.09 | 100.15 | 100.18 |
|
|
