CheesecakeFactory CAKE full analysis,charts,indicators,moving averages,SMA,DMA,EMA,ADX,MACD,RSICheesecake Factory CAKE WideScreen charts, DMA,SMA,EMA technical analysis, forecast prediction, by indicators ADX,MACD,RSI,CCI USA stock exchange
operates under Consumer Services sector & deals in Restaurants
Daily price and charts and targets CheesecakeFactory Strong Daily Stock price targets for CheesecakeFactory CAKE are 54.15 and 54.91 | Daily Target 1 | 53.57 | | Daily Target 2 | 53.97 | | Daily Target 3 | 54.33 | | Daily Target 4 | 54.73 | | Daily Target 5 | 55.09 |
Daily price and volume Cheesecake Factory
| Date |
Closing |
Open |
Range |
Volume |
Mon 20 October 2025 |
54.37 (0.74%) |
54.15 |
53.93 - 54.69 |
0.5523 times |
Fri 17 October 2025 |
53.97 (-0.55%) |
53.86 |
53.71 - 54.63 |
0.6708 times |
Thu 16 October 2025 |
54.27 (-0.28%) |
54.43 |
54.03 - 55.01 |
0.9662 times |
Wed 15 October 2025 |
54.42 (-0.15%) |
54.86 |
54.22 - 55.28 |
0.9583 times |
Tue 14 October 2025 |
54.50 (1.36%) |
53.12 |
53.00 - 55.17 |
1.0937 times |
Mon 13 October 2025 |
53.77 (3.25%) |
53.04 |
52.56 - 53.80 |
1.582 times |
Fri 10 October 2025 |
52.08 (-2.94%) |
53.76 |
51.78 - 53.95 |
1.2232 times |
Thu 09 October 2025 |
53.66 (0.6%) |
53.56 |
53.56 - 54.50 |
0.6724 times |
Wed 08 October 2025 |
53.34 (-1.26%) |
54.25 |
53.00 - 54.29 |
1.0109 times |
Tue 07 October 2025 |
54.02 (-1.24%) |
54.02 |
53.20 - 54.64 |
1.2702 times |
Mon 06 October 2025 |
54.70 (-0.18%) |
55.54 |
54.14 - 56.00 |
0.9825 times |
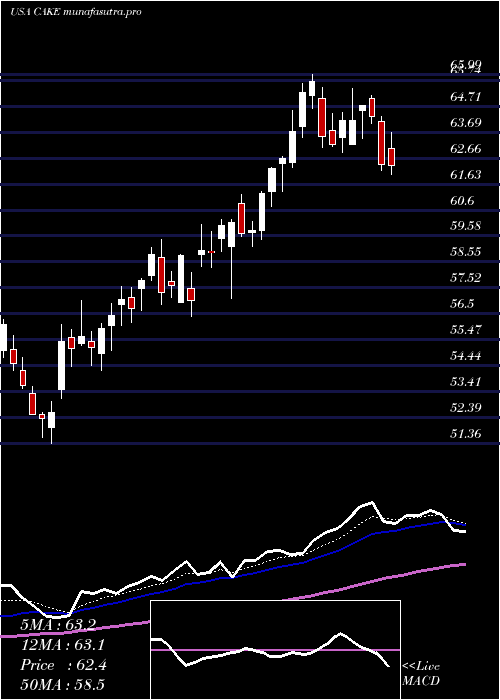
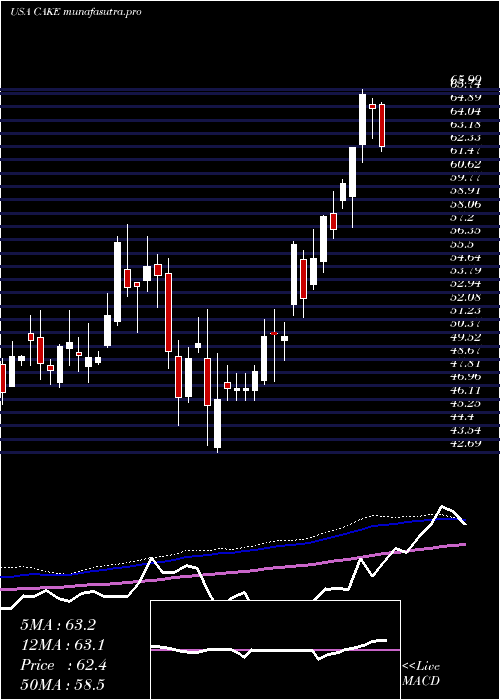
Weekly price and charts CheesecakeFactory Strong weekly Stock price targets for CheesecakeFactory CAKE are 54.15 and 54.91 | Weekly Target 1 | 53.57 | | Weekly Target 2 | 53.97 | | Weekly Target 3 | 54.33 | | Weekly Target 4 | 54.73 | | Weekly Target 5 | 55.09 |
Weekly price and volumes for Cheesecake Factory
| Date |
Closing |
Open |
Range |
Volume |
Mon 20 October 2025 |
54.37 (0.74%) |
54.15 |
53.93 - 54.69 |
0.1092 times |
Fri 17 October 2025 |
53.97 (3.63%) |
53.04 |
52.56 - 55.28 |
1.0421 times |
Fri 10 October 2025 |
52.08 (-4.96%) |
55.54 |
51.78 - 56.00 |
1.02 times |
Fri 03 October 2025 |
54.80 (0.09%) |
55.45 |
53.79 - 55.83 |
1.1514 times |
Fri 26 September 2025 |
54.75 (0.31%) |
54.46 |
53.60 - 55.44 |
1.237 times |
Fri 19 September 2025 |
54.58 (-3.45%) |
56.58 |
53.38 - 56.76 |
1.9197 times |
Fri 12 September 2025 |
56.53 (-6.76%) |
60.75 |
56.27 - 60.85 |
1.5083 times |
Fri 05 September 2025 |
60.63 (-1.35%) |
60.59 |
60.13 - 62.42 |
0.72 times |
Fri 29 August 2025 |
61.46 (0%) |
62.03 |
61.34 - 62.28 |
0.1731 times |
Fri 29 August 2025 |
61.46 (-1.99%) |
62.71 |
61.34 - 62.94 |
1.1191 times |
Fri 22 August 2025 |
62.71 (-0.44%) |
62.87 |
60.90 - 64.04 |
1.1345 times |
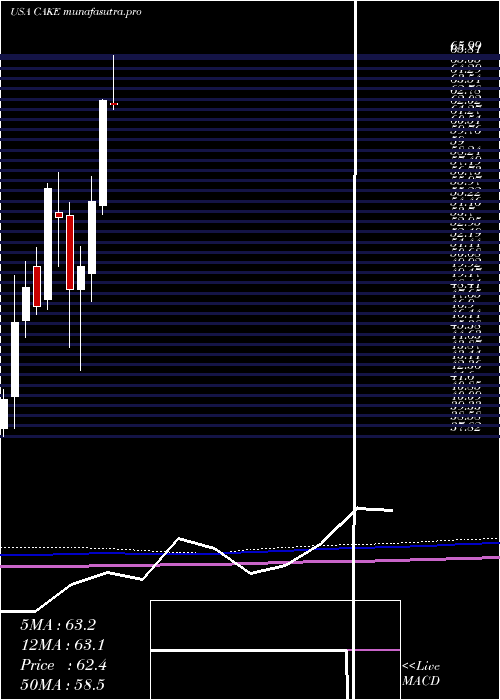
Monthly price and charts CheesecakeFactory Strong monthly Stock price targets for CheesecakeFactory CAKE are 50.97 and 55.19 | Monthly Target 1 | 49.83 | | Monthly Target 2 | 52.1 | | Monthly Target 3 | 54.05 | | Monthly Target 4 | 56.32 | | Monthly Target 5 | 58.27 |
Monthly price and volumes Cheesecake Factory
| Date |
Closing |
Open |
Range |
Volume |
Mon 20 October 2025 |
54.37 (-0.49%) |
54.45 |
51.78 - 56.00 |
0.4754 times |
Tue 30 September 2025 |
54.64 (-11.1%) |
60.59 |
53.38 - 62.42 |
1.0228 times |
Fri 29 August 2025 |
61.46 (-3.83%) |
63.42 |
60.69 - 64.87 |
0.9546 times |
Thu 31 July 2025 |
63.91 (1.99%) |
62.48 |
60.51 - 69.70 |
1.254 times |
Mon 30 June 2025 |
62.66 (13.58%) |
54.93 |
54.27 - 62.72 |
0.9666 times |
Fri 30 May 2025 |
55.17 (9.53%) |
49.85 |
47.78 - 57.02 |
0.9265 times |
Wed 30 April 2025 |
50.37 (3.51%) |
48.65 |
42.69 - 51.89 |
1.0122 times |
Mon 31 March 2025 |
48.66 (-9.94%) |
54.19 |
44.40 - 55.14 |
0.9548 times |
Fri 28 February 2025 |
54.03 (-3.78%) |
54.42 |
50.36 - 57.32 |
1.3714 times |
Fri 31 January 2025 |
56.15 (18.36%) |
47.96 |
47.20 - 56.55 |
1.0617 times |
Tue 31 December 2024 |
47.44 (-2.89%) |
50.35 |
46.84 - 51.80 |
0.5805 times |
DMA SMA EMA moving averages of Cheesecake Factory CAKE
DMA (daily moving average) of Cheesecake Factory CAKE
| DMA period | DMA value | | 5 day DMA | 54.31 | | 12 day DMA | 53.99 | | 20 day DMA | 54.32 | | 35 day DMA | 55.78 | | 50 day DMA | 57.74 | | 100 day DMA | 59.58 | | 150 day DMA | 56.25 | | 200 day DMA | 55.1 | EMA (exponential moving average) of Cheesecake Factory CAKE
| EMA period | EMA current | EMA prev | EMA prev2 | | 5 day EMA | 54.16 | 54.06 | 54.11 | | 12 day EMA | 54.21 | 54.18 | 54.22 | | 20 day EMA | 54.68 | 54.71 | 54.79 | | 35 day EMA | 56.15 | 56.25 | 56.38 | | 50 day EMA | 57.72 | 57.86 | 58.02 |
SMA (simple moving average) of Cheesecake Factory CAKE
| SMA period | SMA current | SMA prev | SMA prev2 | | 5 day SMA | 54.31 | 54.19 | 53.81 | | 12 day SMA | 53.99 | 54.06 | 54.12 | | 20 day SMA | 54.32 | 54.29 | 54.32 | | 35 day SMA | 55.78 | 55.98 | 56.2 | | 50 day SMA | 57.74 | 57.89 | 58.04 | | 100 day SMA | 59.58 | 59.59 | 59.58 | | 150 day SMA | 56.25 | 56.19 | 56.15 | | 200 day SMA | 55.1 | 55.07 | 55.04 |
|
|
