CaiInternational CAI full analysis,charts,indicators,moving averages,SMA,DMA,EMA,ADX,MACD,RSICai International CAI WideScreen charts, DMA,SMA,EMA technical analysis, forecast prediction, by indicators ADX,MACD,RSI,CCI USA stock exchange
operates under Technology sector & deals in Diversified Commercial Services
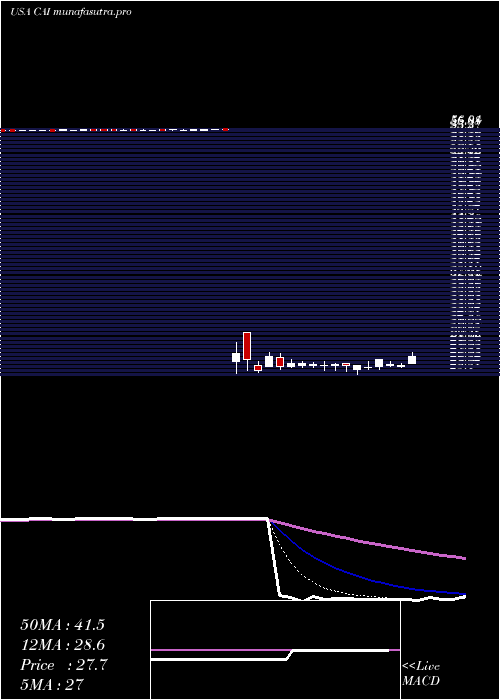
Daily price and charts and targets CaiInternational Strong Daily Stock price targets for CaiInternational CAI are 27.62 and 29.12 | Daily Target 1 | 26.38 | | Daily Target 2 | 27.36 | | Daily Target 3 | 27.88 | | Daily Target 4 | 28.86 | | Daily Target 5 | 29.38 |
Daily price and volume Cai International
| Date |
Closing |
Open |
Range |
Volume |
Thu 04 December 2025 |
28.34 (4.04%) |
27.24 |
26.90 - 28.40 |
0.6344 times |
Wed 03 December 2025 |
27.24 (4.33%) |
25.89 |
25.63 - 27.42 |
1.0778 times |
Tue 02 December 2025 |
26.11 (0.23%) |
26.14 |
25.51 - 27.56 |
3.3068 times |
Mon 01 December 2025 |
26.05 (2.04%) |
25.31 |
25.10 - 28.10 |
1.5249 times |
Fri 28 November 2025 |
25.53 (1.75%) |
25.06 |
24.38 - 25.77 |
0.3943 times |
Wed 26 November 2025 |
25.09 (-1.92%) |
25.54 |
24.42 - 25.54 |
0.6446 times |
Tue 25 November 2025 |
25.58 (1.71%) |
25.15 |
24.64 - 25.71 |
0.4904 times |
Mon 24 November 2025 |
25.15 (4.4%) |
24.32 |
24.02 - 25.50 |
0.6381 times |
Fri 21 November 2025 |
24.09 (0.25%) |
23.90 |
23.61 - 25.27 |
0.5323 times |
Thu 20 November 2025 |
24.03 (0.54%) |
24.20 |
23.39 - 24.46 |
0.7564 times |
Wed 19 November 2025 |
23.90 (0.59%) |
23.86 |
23.23 - 25.36 |
0.6084 times |
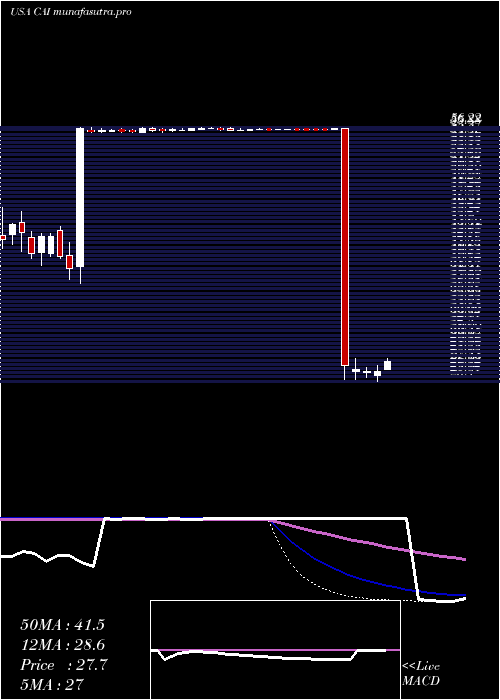
Weekly price and charts CaiInternational Strong weekly Stock price targets for CaiInternational CAI are 26.72 and 30.02 | Weekly Target 1 | 23.98 | | Weekly Target 2 | 26.16 | | Weekly Target 3 | 27.28 | | Weekly Target 4 | 29.46 | | Weekly Target 5 | 30.58 |
Weekly price and volumes for Cai International
| Date |
Closing |
Open |
Range |
Volume |
Thu 04 December 2025 |
28.34 (11.01%) |
25.31 |
25.10 - 28.40 |
2.9155 times |
Fri 28 November 2025 |
25.53 (5.98%) |
24.32 |
24.02 - 25.77 |
0.9656 times |
Fri 21 November 2025 |
24.09 (1.01%) |
23.85 |
23.00 - 25.36 |
1.2859 times |
Fri 14 November 2025 |
23.85 (-6.87%) |
26.19 |
23.00 - 26.19 |
1.0539 times |
Fri 07 November 2025 |
25.61 (-14.86%) |
29.51 |
22.86 - 31.78 |
1.6807 times |
Fri 31 October 2025 |
30.08 (0%) |
31.31 |
29.73 - 31.90 |
0.0891 times |
Fri 31 October 2025 |
30.08 (-3.19%) |
31.37 |
28.94 - 32.25 |
0.5876 times |
Fri 24 October 2025 |
31.07 (-1.37%) |
31.76 |
29.38 - 33.13 |
0.3502 times |
Fri 17 October 2025 |
31.50 (3.35%) |
30.50 |
29.25 - 33.65 |
0.4752 times |
Fri 10 October 2025 |
30.48 (-4.06%) |
32.00 |
30.04 - 33.66 |
0.5961 times |
Fri 03 October 2025 |
31.77 (8.84%) |
29.31 |
28.70 - 31.94 |
0.5786 times |
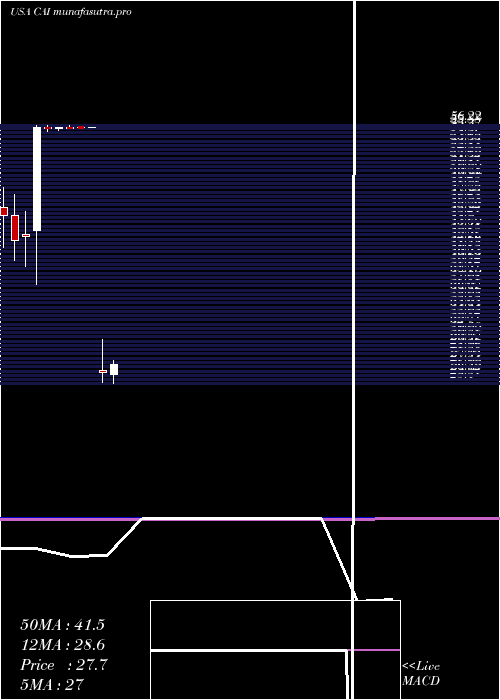
Monthly price and charts CaiInternational Strong monthly Stock price targets for CaiInternational CAI are 26.72 and 30.02 | Monthly Target 1 | 23.98 | | Monthly Target 2 | 26.16 | | Monthly Target 3 | 27.28 | | Monthly Target 4 | 29.46 | | Monthly Target 5 | 30.58 |
Monthly price and volumes Cai International
| Date |
Closing |
Open |
Range |
Volume |
Thu 04 December 2025 |
28.34 (11.01%) |
25.31 |
25.10 - 28.40 |
1.2901 times |
Fri 28 November 2025 |
25.53 (-15.13%) |
29.51 |
22.86 - 31.78 |
2.2065 times |
Fri 31 October 2025 |
30.08 (-0.56%) |
30.14 |
28.94 - 33.66 |
1.0695 times |
Tue 30 September 2025 |
30.25 (-21.2%) |
37.90 |
28.20 - 38.68 |
1.0169 times |
Fri 29 August 2025 |
38.39 (36.72%) |
27.80 |
27.26 - 42.50 |
1.0047 times |
Thu 31 July 2025 |
28.08 (5.09%) |
26.50 |
25.40 - 33.37 |
0.8419 times |
Mon 30 June 2025 |
26.72 (-52.29%) |
27.00 |
25.56 - 30.70 |
1.9094 times |
Mon 22 November 2021 |
56.00 (0.13%) |
55.96 |
55.92 - 56.01 |
0.1565 times |
Fri 29 October 2021 |
55.93 (0.04%) |
55.94 |
55.87 - 56.00 |
0.1556 times |
Thu 30 September 2021 |
55.91 (-0.11%) |
55.99 |
55.81 - 56.22 |
0.349 times |
Tue 31 August 2021 |
55.97 (0.29%) |
55.89 |
55.62 - 56.00 |
0.3155 times |
DMA SMA EMA moving averages of Cai International CAI
DMA (daily moving average) of Cai International CAI
| DMA period | DMA value | | 5 day DMA | 26.65 | | 12 day DMA | 25.41 | | 20 day DMA | 25.08 | | 35 day DMA | 27.51 | | 50 day DMA | 28.5 | | 100 day DMA | 30.86 | | 150 day DMA | 35.74 | | 200 day DMA | 40.78 | EMA (exponential moving average) of Cai International CAI
| EMA period | EMA current | EMA prev | EMA prev2 | | 5 day EMA | 26.91 | 26.19 | 25.66 | | 12 day EMA | 26.11 | 25.71 | 25.43 | | 20 day EMA | 26.27 | 26.05 | 25.93 | | 35 day EMA | 27.14 | 27.07 | 27.06 | | 50 day EMA | 28.63 | 28.64 | 28.7 |
SMA (simple moving average) of Cai International CAI
| SMA period | SMA current | SMA prev | SMA prev2 | | 5 day SMA | 26.65 | 26 | 25.67 | | 12 day SMA | 25.41 | 25.02 | 24.74 | | 20 day SMA | 25.08 | 25.13 | 25.32 | | 35 day SMA | 27.51 | 27.59 | 27.68 | | 50 day SMA | 28.5 | 28.54 | 28.64 | | 100 day SMA | 30.86 | 30.86 | 30.87 | | 150 day SMA | 35.74 | 35.93 | 36.12 | | 200 day SMA | 40.78 | 40.92 | 41.06 |
|
|
