CamdenNational CAC full analysis,charts,indicators,moving averages,SMA,DMA,EMA,ADX,MACD,RSICamden National CAC WideScreen charts, DMA,SMA,EMA technical analysis, forecast prediction, by indicators ADX,MACD,RSI,CCI USA stock exchange
operates under Finance sector & deals in Major Banks
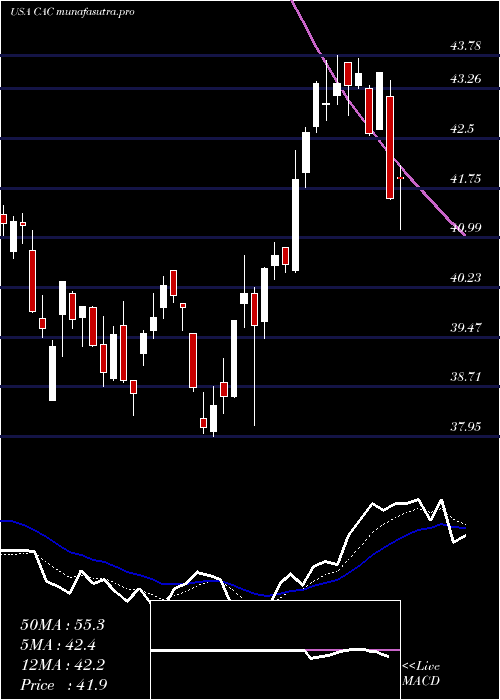
Daily price and charts and targets CamdenNational Strong Daily Stock price targets for CamdenNational CAC are 36.82 and 37.31 | Daily Target 1 | 36.43 | | Daily Target 2 | 36.71 | | Daily Target 3 | 36.923333333333 | | Daily Target 4 | 37.2 | | Daily Target 5 | 37.41 |
Daily price and volume Camden National
| Date |
Closing |
Open |
Range |
Volume |
Tue 21 October 2025 |
36.98 (0.52%) |
36.67 |
36.65 - 37.14 |
0.5043 times |
Mon 20 October 2025 |
36.79 (3.08%) |
35.92 |
35.50 - 36.81 |
0.6607 times |
Fri 17 October 2025 |
35.69 (0.68%) |
35.51 |
35.43 - 36.06 |
0.8213 times |
Thu 16 October 2025 |
35.45 (-4.32%) |
37.02 |
35.00 - 37.02 |
1.0397 times |
Wed 15 October 2025 |
37.05 (-3.47%) |
37.95 |
36.68 - 38.34 |
0.7346 times |
Tue 14 October 2025 |
38.38 (3.7%) |
36.81 |
36.81 - 38.39 |
1.6801 times |
Mon 13 October 2025 |
37.01 (1.51%) |
37.17 |
36.26 - 37.17 |
1.1136 times |
Fri 10 October 2025 |
36.46 (-2.85%) |
37.55 |
36.40 - 38.07 |
1.7839 times |
Thu 09 October 2025 |
37.53 (-2.42%) |
38.26 |
37.45 - 39.37 |
1.2517 times |
Wed 08 October 2025 |
38.46 (-0.26%) |
38.82 |
38.32 - 38.90 |
0.4101 times |
Tue 07 October 2025 |
38.56 (-1.63%) |
39.32 |
38.46 - 39.54 |
0.4412 times |
Weekly price and charts CamdenNational Strong weekly Stock price targets for CamdenNational CAC are 36.24 and 37.88 | Weekly Target 1 | 34.9 | | Weekly Target 2 | 35.94 | | Weekly Target 3 | 36.54 | | Weekly Target 4 | 37.58 | | Weekly Target 5 | 38.18 |
Weekly price and volumes for Camden National
| Date |
Closing |
Open |
Range |
Volume |
Tue 21 October 2025 |
36.98 (3.61%) |
35.92 |
35.50 - 37.14 |
0.3686 times |
Fri 17 October 2025 |
35.69 (-2.11%) |
37.17 |
35.00 - 38.39 |
1.7053 times |
Fri 10 October 2025 |
36.46 (-4.95%) |
38.81 |
36.40 - 39.54 |
1.4377 times |
Fri 03 October 2025 |
38.36 (-3.55%) |
39.84 |
37.50 - 39.84 |
1.0376 times |
Fri 26 September 2025 |
39.77 (-1.12%) |
40.21 |
38.77 - 40.45 |
1.2039 times |
Fri 19 September 2025 |
40.22 (-0.52%) |
40.36 |
39.50 - 41.74 |
1.4187 times |
Fri 12 September 2025 |
40.43 (-0.32%) |
40.71 |
39.82 - 40.79 |
0.8213 times |
Fri 05 September 2025 |
40.56 (-0.81%) |
40.35 |
40.01 - 41.44 |
0.7763 times |
Fri 29 August 2025 |
40.89 (0%) |
41.06 |
40.11 - 41.22 |
0.2883 times |
Fri 29 August 2025 |
40.89 (0.39%) |
40.56 |
39.61 - 41.44 |
0.9423 times |
Fri 22 August 2025 |
40.73 (5.19%) |
38.72 |
38.34 - 40.83 |
1.066 times |
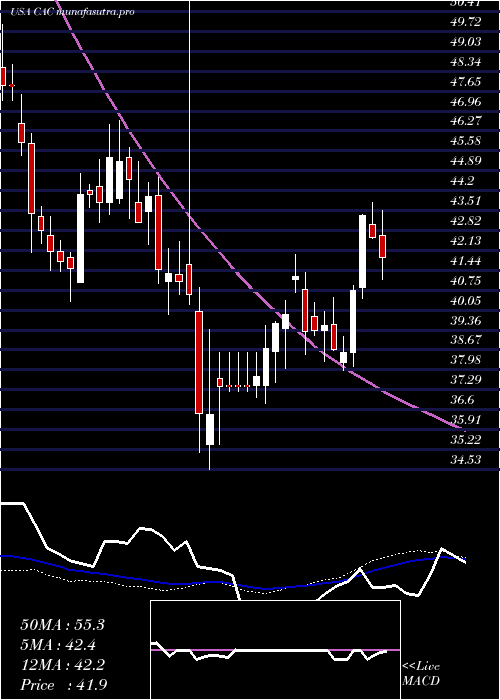
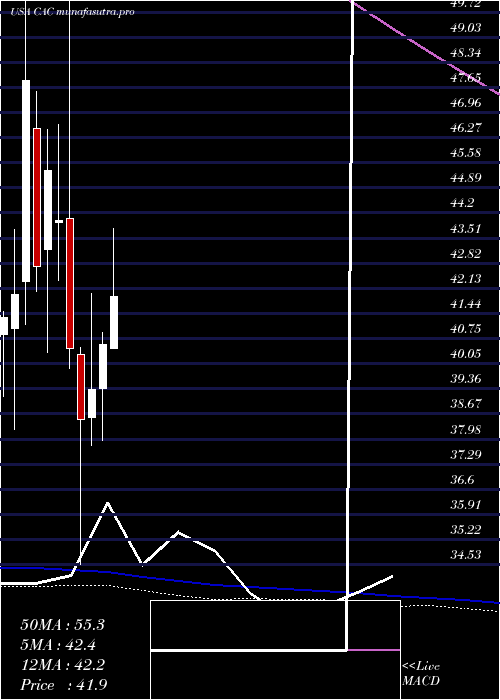
Monthly price and charts CamdenNational Strong monthly Stock price targets for CamdenNational CAC are 33.72 and 38.26 | Monthly Target 1 | 32.63 | | Monthly Target 2 | 34.81 | | Monthly Target 3 | 37.173333333333 | | Monthly Target 4 | 39.35 | | Monthly Target 5 | 41.71 |
Monthly price and volumes Camden National
| Date |
Closing |
Open |
Range |
Volume |
Tue 21 October 2025 |
36.98 (-4.17%) |
38.25 |
35.00 - 39.54 |
0.8247 times |
Tue 30 September 2025 |
38.59 (-5.62%) |
40.35 |
38.08 - 41.74 |
0.8987 times |
Fri 29 August 2025 |
40.89 (8.43%) |
37.42 |
36.53 - 41.44 |
0.9452 times |
Thu 31 July 2025 |
37.71 (-7.07%) |
40.48 |
36.31 - 43.78 |
1.1724 times |
Mon 30 June 2025 |
40.58 (3.15%) |
39.36 |
37.95 - 40.92 |
0.7044 times |
Fri 30 May 2025 |
39.34 (2.13%) |
38.57 |
37.80 - 41.98 |
0.7696 times |
Wed 30 April 2025 |
38.52 (-4.82%) |
40.30 |
34.53 - 40.49 |
1.303 times |
Mon 31 March 2025 |
40.47 (-7.98%) |
44.04 |
39.92 - 8091.39 |
1.2682 times |
Fri 28 February 2025 |
43.98 (-3.04%) |
43.94 |
42.33 - 46.62 |
0.8206 times |
Fri 31 January 2025 |
45.36 (6.13%) |
43.19 |
40.37 - 46.49 |
1.2933 times |
Tue 31 December 2024 |
42.74 (-10.66%) |
46.52 |
42.04 - 47.55 |
0.6665 times |
DMA SMA EMA moving averages of Camden National CAC
DMA (daily moving average) of Camden National CAC
| DMA period | DMA value | | 5 day DMA | 36.39 | | 12 day DMA | 37.3 | | 20 day DMA | 37.87 | | 35 day DMA | 38.91 | | 50 day DMA | 39.22 | | 100 day DMA | 39.69 | | 150 day DMA | 92.8 | | 200 day DMA | 80.47 | EMA (exponential moving average) of Camden National CAC
| EMA period | EMA current | EMA prev | EMA prev2 | | 5 day EMA | 36.7 | 36.56 | 36.45 | | 12 day EMA | 37.19 | 37.23 | 37.31 | | 20 day EMA | 37.71 | 37.79 | 37.89 | | 35 day EMA | 38.25 | 38.33 | 38.42 | | 50 day EMA | 38.81 | 38.88 | 38.97 |
SMA (simple moving average) of Camden National CAC
| SMA period | SMA current | SMA prev | SMA prev2 | | 5 day SMA | 36.39 | 36.67 | 36.72 | | 12 day SMA | 37.3 | 37.41 | 37.5 | | 20 day SMA | 37.87 | 37.99 | 38.14 | | 35 day SMA | 38.91 | 39.01 | 39.13 | | 50 day SMA | 39.22 | 39.26 | 39.28 | | 100 day SMA | 39.69 | 39.72 | 39.76 | | 150 day SMA | 92.8 | 92.83 | 92.86 | | 200 day SMA | 80.47 | 80.5 | 80.52 |
|
|
