CableOne CABO full analysis,charts,indicators,moving averages,SMA,DMA,EMA,ADX,MACD,RSICable One CABO WideScreen charts, DMA,SMA,EMA technical analysis, forecast prediction, by indicators ADX,MACD,RSI,CCI USA stock exchange
operates under Consumer Services sector & deals in Television Services
Daily price and charts and targets CableOne Strong Daily Stock price targets for CableOne CABO are 121.71 and 127.74 | Daily Target 1 | 117.09 | | Daily Target 2 | 120.29 | | Daily Target 3 | 123.12 | | Daily Target 4 | 126.32 | | Daily Target 5 | 129.15 |
Daily price and volume Cable One
| Date |
Closing |
Open |
Range |
Volume |
Thu 04 December 2025 |
123.49 (1.73%) |
121.97 |
119.92 - 125.95 |
0.7114 times |
Wed 03 December 2025 |
121.39 (0.73%) |
121.11 |
119.21 - 124.37 |
0.6907 times |
Tue 02 December 2025 |
120.51 (-0.46%) |
120.49 |
119.01 - 123.16 |
0.8743 times |
Mon 01 December 2025 |
121.07 (3.31%) |
116.78 |
114.92 - 122.47 |
1.3527 times |
Fri 28 November 2025 |
117.19 (3.69%) |
113.90 |
112.02 - 117.76 |
0.8374 times |
Wed 26 November 2025 |
113.02 (-0.3%) |
112.07 |
109.17 - 114.98 |
1.125 times |
Tue 25 November 2025 |
113.36 (7.73%) |
105.61 |
104.18 - 114.00 |
0.9945 times |
Mon 24 November 2025 |
105.23 (-3.57%) |
110.91 |
103.95 - 110.91 |
1.1257 times |
Fri 21 November 2025 |
109.13 (8.67%) |
100.34 |
100.34 - 109.14 |
1.1662 times |
Thu 20 November 2025 |
100.42 (-1.04%) |
102.18 |
99.36 - 105.86 |
1.122 times |
Wed 19 November 2025 |
101.48 (-2.85%) |
104.90 |
96.67 - 104.90 |
1.599 times |
Weekly price and charts CableOne Strong weekly Stock price targets for CableOne CABO are 119.21 and 130.24 | Weekly Target 1 | 110.42 | | Weekly Target 2 | 116.96 | | Weekly Target 3 | 121.45333333333 | | Weekly Target 4 | 127.99 | | Weekly Target 5 | 132.48 |
Weekly price and volumes for Cable One
| Date |
Closing |
Open |
Range |
Volume |
Thu 04 December 2025 |
123.49 (5.38%) |
116.78 |
114.92 - 125.95 |
0.9492 times |
Fri 28 November 2025 |
117.19 (7.39%) |
110.91 |
103.95 - 117.76 |
1.0678 times |
Fri 21 November 2025 |
109.13 (1.3%) |
107.29 |
96.67 - 109.85 |
1.7257 times |
Fri 14 November 2025 |
107.73 (-18.06%) |
131.76 |
105.26 - 135.29 |
1.6173 times |
Fri 07 November 2025 |
131.48 (-11.49%) |
145.70 |
116.13 - 147.53 |
1.0744 times |
Fri 31 October 2025 |
148.55 (0%) |
139.00 |
136.80 - 148.77 |
0.1722 times |
Fri 31 October 2025 |
148.55 (-7.77%) |
161.88 |
136.80 - 167.36 |
0.8096 times |
Fri 24 October 2025 |
161.06 (-1.76%) |
164.60 |
153.32 - 168.55 |
0.8981 times |
Fri 17 October 2025 |
163.95 (5.45%) |
155.48 |
151.77 - 164.61 |
0.7223 times |
Fri 10 October 2025 |
155.48 (-12.89%) |
179.00 |
155.12 - 180.74 |
0.9633 times |
Fri 03 October 2025 |
178.48 (7.2%) |
166.02 |
162.43 - 178.85 |
0.9346 times |
Monthly price and charts CableOne Strong monthly Stock price targets for CableOne CABO are 119.21 and 130.24 | Monthly Target 1 | 110.42 | | Monthly Target 2 | 116.96 | | Monthly Target 3 | 121.45333333333 | | Monthly Target 4 | 127.99 | | Monthly Target 5 | 132.48 |
Monthly price and volumes Cable One
| Date |
Closing |
Open |
Range |
Volume |
Thu 04 December 2025 |
123.49 (5.38%) |
116.78 |
114.92 - 125.95 |
0.1495 times |
Fri 28 November 2025 |
117.19 (-21.11%) |
145.70 |
96.67 - 147.53 |
0.864 times |
Fri 31 October 2025 |
148.55 (-16.1%) |
178.01 |
136.80 - 180.74 |
0.6294 times |
Tue 30 September 2025 |
177.05 (9.64%) |
159.95 |
150.66 - 179.73 |
0.7521 times |
Fri 29 August 2025 |
161.48 (26.18%) |
138.80 |
124.10 - 164.50 |
1.0348 times |
Thu 31 July 2025 |
127.98 (-5.77%) |
134.37 |
117.54 - 159.36 |
1.4717 times |
Mon 30 June 2025 |
135.81 (-7.19%) |
145.31 |
121.37 - 148.00 |
1.3578 times |
Fri 30 May 2025 |
146.33 (-45.25%) |
269.17 |
140.69 - 269.17 |
1.9109 times |
Wed 30 April 2025 |
267.27 (0.56%) |
267.54 |
234.72 - 277.56 |
0.6722 times |
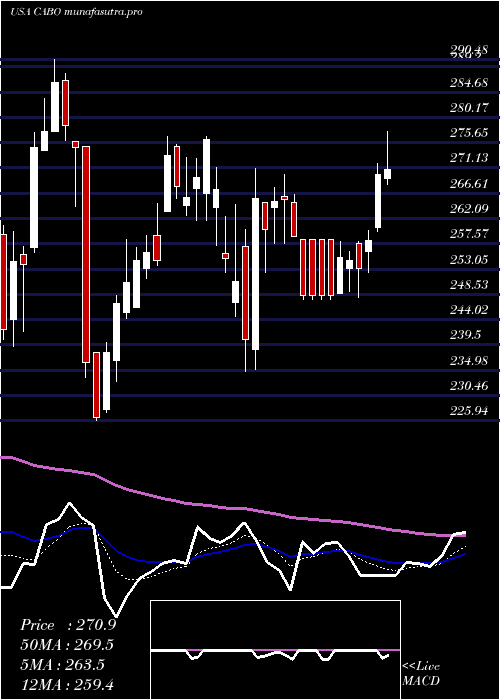
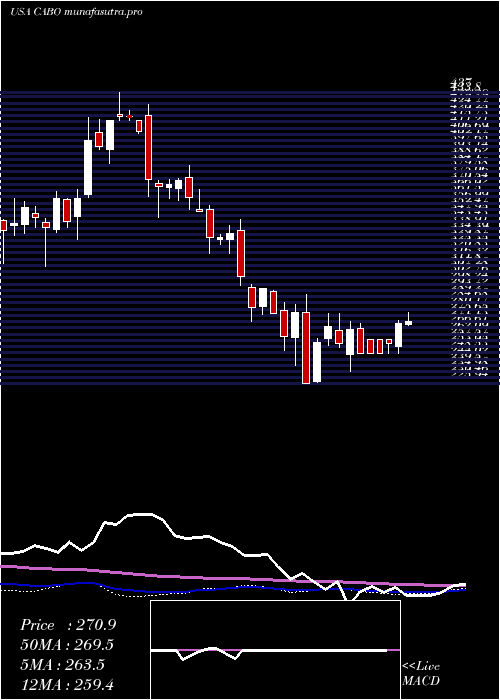
Mon 31 March 2025 |
265.77 (2.15%) |
259.32 |
225.94 - 290.48 |
1.1576 times |
Fri 28 February 2025 |
260.18 (-14.42%) |
295.70 |
250.08 - 298.15 |
0.8956 times |

DMA SMA EMA moving averages of Cable One CABO
DMA (daily moving average) of Cable One CABO
| DMA period | DMA value | | 5 day DMA | 120.73 | | 12 day DMA | 112.56 | | 20 day DMA | 114.99 | | 35 day DMA | 132.57 | | 50 day DMA | 143.11 | | 100 day DMA | 148 | | 150 day DMA | 147.59 | | 200 day DMA | 176.03 | EMA (exponential moving average) of Cable One CABO
| EMA period | EMA current | EMA prev | EMA prev2 | | 5 day EMA | 120.14 | 118.47 | 117.01 | | 12 day EMA | 117.73 | 116.68 | 115.82 | | 20 day EMA | 120.88 | 120.61 | 120.53 | | 35 day EMA | 130.09 | 130.48 | 131.02 | | 50 day EMA | 142.82 | 143.61 | 144.52 |
SMA (simple moving average) of Cable One CABO
| SMA period | SMA current | SMA prev | SMA prev2 | | 5 day SMA | 120.73 | 118.64 | 117.03 | | 12 day SMA | 112.56 | 111.19 | 110.05 | | 20 day SMA | 114.99 | 115.99 | 117.12 | | 35 day SMA | 132.57 | 133.65 | 134.81 | | 50 day SMA | 143.11 | 143.93 | 144.73 | | 100 day SMA | 148 | 147.97 | 148 | | 150 day SMA | 147.59 | 148.55 | 149.55 | | 200 day SMA | 176.03 | 176.86 | 177.73 |
|
|
