BaozunInc BZUN full analysis,charts,indicators,moving averages,SMA,DMA,EMA,ADX,MACD,RSIBaozun Inc BZUN WideScreen charts, DMA,SMA,EMA technical analysis, forecast prediction, by indicators ADX,MACD,RSI,CCI USA stock exchange
operates under Consumer Services sector & deals in Catalog Specialty Distribution
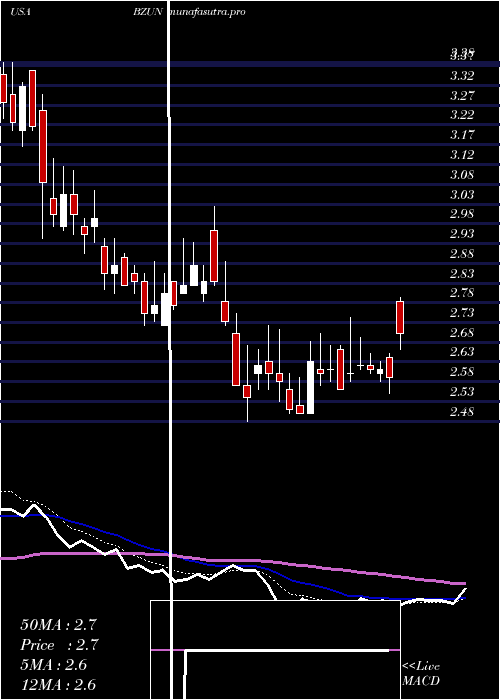
Daily price and charts and targets BaozunInc Strong Daily Stock price targets for BaozunInc BZUN are 2.91 and 3.03 | Daily Target 1 | 2.82 | | Daily Target 2 | 2.87 | | Daily Target 3 | 2.9366666666667 | | Daily Target 4 | 2.99 | | Daily Target 5 | 3.06 |
Daily price and volume Baozun Inc
| Date |
Closing |
Open |
Range |
Volume |
Thu 04 December 2025 |
2.93 (2.81%) |
2.88 |
2.88 - 3.00 |
0.7757 times |
Wed 03 December 2025 |
2.85 (2.15%) |
2.76 |
2.73 - 2.85 |
0.9926 times |
Tue 02 December 2025 |
2.79 (-3.46%) |
2.88 |
2.74 - 2.89 |
1.0338 times |
Mon 01 December 2025 |
2.89 (1.05%) |
2.88 |
2.83 - 2.95 |
1.0333 times |
Fri 28 November 2025 |
2.86 (3.25%) |
2.79 |
2.79 - 2.87 |
0.532 times |
Wed 26 November 2025 |
2.77 (0.73%) |
2.80 |
2.74 - 2.84 |
0.7467 times |
Tue 25 November 2025 |
2.75 (-5.82%) |
2.92 |
2.66 - 3.04 |
2.04 times |
Mon 24 November 2025 |
2.92 (2.82%) |
2.89 |
2.86 - 2.98 |
1.0807 times |
Fri 21 November 2025 |
2.84 (1.07%) |
2.81 |
2.77 - 2.89 |
0.6622 times |
Thu 20 November 2025 |
2.81 (-1.06%) |
2.84 |
2.81 - 2.91 |
1.103 times |
Wed 19 November 2025 |
2.84 (-4.05%) |
2.96 |
2.79 - 2.97 |
0.6985 times |
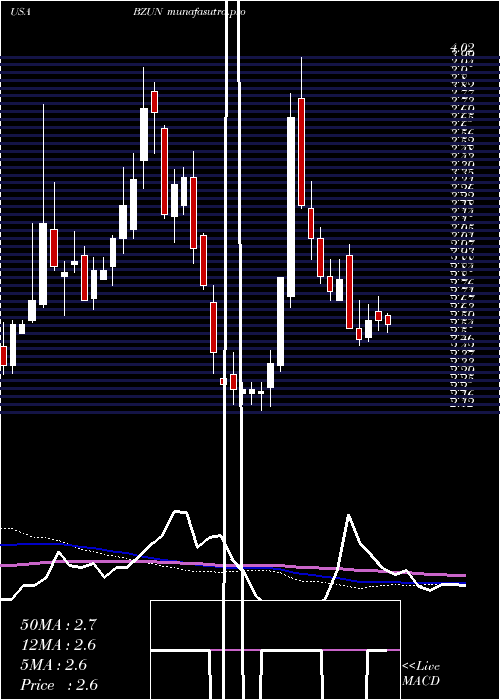
Weekly price and charts BaozunInc Strong weekly Stock price targets for BaozunInc BZUN are 2.83 and 3.1 | Weekly Target 1 | 2.62 | | Weekly Target 2 | 2.77 | | Weekly Target 3 | 2.8866666666667 | | Weekly Target 4 | 3.04 | | Weekly Target 5 | 3.16 |
Weekly price and volumes for Baozun Inc
| Date |
Closing |
Open |
Range |
Volume |
Thu 04 December 2025 |
2.93 (2.45%) |
2.88 |
2.73 - 3.00 |
0.9818 times |
Fri 28 November 2025 |
2.86 (0.7%) |
2.89 |
2.66 - 3.04 |
1.1262 times |
Fri 21 November 2025 |
2.84 (-4.38%) |
2.94 |
2.77 - 2.99 |
1.0673 times |
Fri 14 November 2025 |
2.97 (-8.33%) |
3.29 |
2.91 - 3.33 |
0.8148 times |
Fri 07 November 2025 |
3.24 (-1.22%) |
3.25 |
3.10 - 3.31 |
0.5746 times |
Fri 31 October 2025 |
3.28 (0%) |
3.34 |
3.25 - 3.45 |
0.2198 times |
Fri 31 October 2025 |
3.28 (-8.89%) |
3.68 |
3.25 - 3.82 |
1.3047 times |
Fri 24 October 2025 |
3.60 (9.42%) |
3.30 |
3.30 - 3.69 |
0.9521 times |
Fri 17 October 2025 |
3.29 (-5.46%) |
3.57 |
3.21 - 3.62 |
1.467 times |
Fri 10 October 2025 |
3.48 (-11.68%) |
3.94 |
3.42 - 4.01 |
1.4919 times |
Fri 03 October 2025 |
3.94 (-2.96%) |
4.11 |
3.93 - 4.27 |
0.9419 times |
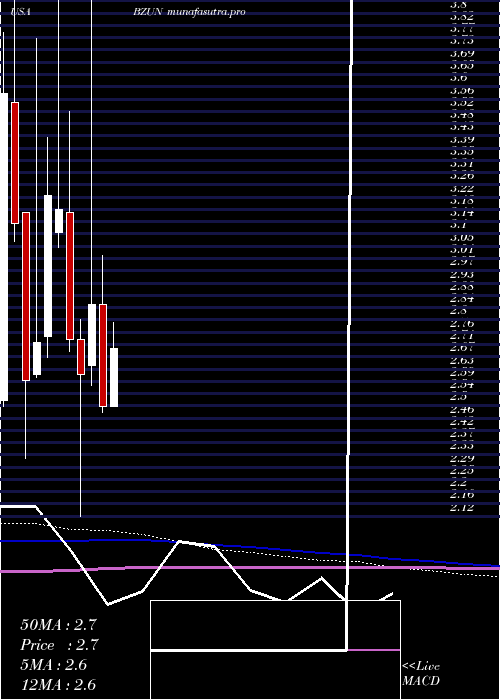
Monthly price and charts BaozunInc Strong monthly Stock price targets for BaozunInc BZUN are 2.83 and 3.1 | Monthly Target 1 | 2.62 | | Monthly Target 2 | 2.77 | | Monthly Target 3 | 2.8866666666667 | | Monthly Target 4 | 3.04 | | Monthly Target 5 | 3.16 |
Monthly price and volumes Baozun Inc
| Date |
Closing |
Open |
Range |
Volume |
Thu 04 December 2025 |
2.93 (2.45%) |
2.88 |
2.73 - 3.00 |
0.1401 times |
Fri 28 November 2025 |
2.86 (-12.8%) |
3.25 |
2.66 - 3.33 |
0.5111 times |
Fri 31 October 2025 |
3.28 (-19.01%) |
4.05 |
3.21 - 4.25 |
0.8463 times |
Tue 30 September 2025 |
4.05 (19.47%) |
3.35 |
3.31 - 4.88 |
2.2756 times |
Fri 29 August 2025 |
3.39 (25.09%) |
2.70 |
2.58 - 3.39 |
0.8907 times |
Thu 31 July 2025 |
2.71 (8.4%) |
2.50 |
2.50 - 3.22 |
1.1413 times |
Mon 30 June 2025 |
2.50 (-12.28%) |
2.85 |
2.48 - 3.02 |
0.7697 times |
Fri 30 May 2025 |
2.85 (9.2%) |
2.64 |
2.57 - 4.02 |
1.3977 times |
Wed 30 April 2025 |
2.61 (-4.4%) |
2.73 |
2.12 - 2.80 |
1.2501 times |
Mon 31 March 2025 |
2.73 (-14.15%) |
3.17 |
2.69 - 3.52 |
0.7774 times |
Fri 28 February 2025 |
3.18 (-1.55%) |
3.10 |
3.05 - 3.97 |
1.3921 times |
DMA SMA EMA moving averages of Baozun Inc BZUN
DMA (daily moving average) of Baozun Inc BZUN
| DMA period | DMA value | | 5 day DMA | 2.86 | | 12 day DMA | 2.85 | | 20 day DMA | 2.95 | | 35 day DMA | 3.15 | | 50 day DMA | 3.35 | | 100 day DMA | 3.34 | | 150 day DMA | 3.19 | | 200 day DMA | 3.11 | EMA (exponential moving average) of Baozun Inc BZUN
| EMA period | EMA current | EMA prev | EMA prev2 | | 5 day EMA | 2.87 | 2.84 | 2.83 | | 12 day EMA | 2.89 | 2.88 | 2.88 | | 20 day EMA | 2.98 | 2.98 | 2.99 | | 35 day EMA | 3.18 | 3.19 | 3.21 | | 50 day EMA | 3.38 | 3.4 | 3.42 |
SMA (simple moving average) of Baozun Inc BZUN
| SMA period | SMA current | SMA prev | SMA prev2 | | 5 day SMA | 2.86 | 2.83 | 2.81 | | 12 day SMA | 2.85 | 2.85 | 2.86 | | 20 day SMA | 2.95 | 2.96 | 2.98 | | 35 day SMA | 3.15 | 3.16 | 3.18 | | 50 day SMA | 3.35 | 3.38 | 3.4 | | 100 day SMA | 3.34 | 3.33 | 3.33 | | 150 day SMA | 3.19 | 3.19 | 3.18 | | 200 day SMA | 3.11 | 3.11 | 3.12 |
|
|
