BlackrockMunicipal BYM full analysis,charts,indicators,moving averages,SMA,DMA,EMA,ADX,MACD,RSIBlackrock Municipal BYM WideScreen charts, DMA,SMA,EMA technical analysis, forecast prediction, by indicators ADX,MACD,RSI,CCI USA stock exchange
operates under N A sector & deals in N A
Daily price and charts and targets BlackrockMunicipal Strong Daily Stock price targets for BlackrockMunicipal BYM are 10.95 and 11.05 | Daily Target 1 | 10.89 | | Daily Target 2 | 10.95 | | Daily Target 3 | 10.993333333333 | | Daily Target 4 | 11.05 | | Daily Target 5 | 11.09 |
Daily price and volume Blackrock Municipal
| Date |
Closing |
Open |
Range |
Volume |
Mon 20 October 2025 |
11.00 (0.27%) |
11.00 |
10.94 - 11.04 |
1.732 times |
Fri 17 October 2025 |
10.97 (-0.63%) |
11.00 |
10.92 - 11.01 |
0.5177 times |
Thu 16 October 2025 |
11.04 (0.18%) |
11.03 |
10.99 - 11.08 |
0.899 times |
Wed 15 October 2025 |
11.02 (-0.36%) |
11.01 |
11.01 - 11.10 |
0.441 times |
Tue 14 October 2025 |
11.06 (0.09%) |
11.03 |
11.03 - 11.11 |
1.2836 times |
Mon 13 October 2025 |
11.05 (0.55%) |
11.04 |
11.00 - 11.06 |
0.6221 times |
Fri 10 October 2025 |
10.99 (0.27%) |
11.00 |
10.98 - 11.09 |
0.7062 times |
Thu 09 October 2025 |
10.96 (0%) |
10.93 |
10.92 - 10.97 |
0.9715 times |
Wed 08 October 2025 |
10.96 (0.37%) |
10.92 |
10.89 - 10.98 |
1.3922 times |
Tue 07 October 2025 |
10.92 (0.74%) |
10.85 |
10.84 - 10.92 |
1.4348 times |
Mon 06 October 2025 |
10.84 (-0.73%) |
10.90 |
10.79 - 10.90 |
1.2583 times |
Weekly price and charts BlackrockMunicipal Strong weekly Stock price targets for BlackrockMunicipal BYM are 10.95 and 11.05 | Weekly Target 1 | 10.89 | | Weekly Target 2 | 10.95 | | Weekly Target 3 | 10.993333333333 | | Weekly Target 4 | 11.05 | | Weekly Target 5 | 11.09 |
Weekly price and volumes for Blackrock Municipal
| Date |
Closing |
Open |
Range |
Volume |
Mon 20 October 2025 |
11.00 (0.27%) |
11.00 |
10.94 - 11.04 |
0.4279 times |
Fri 17 October 2025 |
10.97 (-0.18%) |
11.04 |
10.92 - 11.11 |
0.9297 times |
Fri 10 October 2025 |
10.99 (0.64%) |
10.90 |
10.79 - 11.09 |
1.4237 times |
Fri 03 October 2025 |
10.92 (0.46%) |
10.91 |
10.86 - 11.04 |
1.5496 times |
Fri 26 September 2025 |
10.87 (-0.82%) |
10.97 |
10.83 - 10.99 |
1.1063 times |
Fri 19 September 2025 |
10.96 (-0.54%) |
11.14 |
10.96 - 11.18 |
0.7679 times |
Fri 12 September 2025 |
11.02 (3.38%) |
10.70 |
10.70 - 11.09 |
1.1965 times |
Fri 05 September 2025 |
10.66 (0.85%) |
10.53 |
10.50 - 10.76 |
1.1542 times |
Fri 29 August 2025 |
10.57 (0%) |
10.52 |
10.46 - 10.57 |
0.2855 times |
Fri 29 August 2025 |
10.57 (0.67%) |
10.49 |
10.40 - 10.57 |
1.1589 times |
Fri 22 August 2025 |
10.50 (-0.57%) |
10.60 |
10.42 - 10.60 |
0.7968 times |
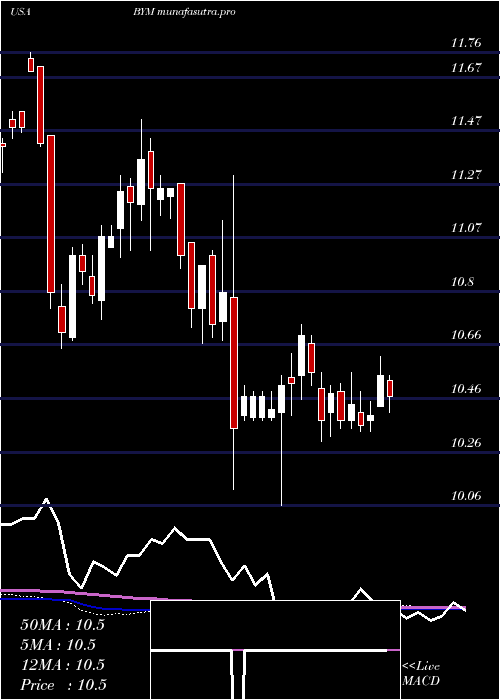
Monthly price and charts BlackrockMunicipal Strong monthly Stock price targets for BlackrockMunicipal BYM are 10.9 and 11.22 | Monthly Target 1 | 10.65 | | Monthly Target 2 | 10.82 | | Monthly Target 3 | 10.966666666667 | | Monthly Target 4 | 11.14 | | Monthly Target 5 | 11.29 |
Monthly price and volumes Blackrock Municipal
| Date |
Closing |
Open |
Range |
Volume |
Mon 20 October 2025 |
11.00 (0.46%) |
10.95 |
10.79 - 11.11 |
0.8004 times |
Tue 30 September 2025 |
10.95 (3.6%) |
10.53 |
10.50 - 11.18 |
0.988 times |
Fri 29 August 2025 |
10.57 (1.44%) |
10.45 |
10.40 - 10.71 |
0.7613 times |
Thu 31 July 2025 |
10.42 (-1.33%) |
10.60 |
10.10 - 10.62 |
1.0804 times |
Mon 30 June 2025 |
10.56 (0.76%) |
10.49 |
10.34 - 10.56 |
0.8483 times |
Fri 30 May 2025 |
10.48 (-1.13%) |
10.57 |
10.30 - 10.74 |
0.9205 times |
Wed 30 April 2025 |
10.60 (-1.67%) |
10.82 |
10.06 - 11.30 |
1.4179 times |
Mon 31 March 2025 |
10.78 (-4.18%) |
11.27 |
10.67 - 11.27 |
1.3636 times |
Fri 28 February 2025 |
11.25 (0.45%) |
11.19 |
11.02 - 11.51 |
0.8111 times |
Fri 31 January 2025 |
11.20 (3.23%) |
10.86 |
10.76 - 11.30 |
1.0086 times |
Tue 31 December 2024 |
10.85 (-5.49%) |
11.74 |
10.65 - 11.76 |
1.5266 times |
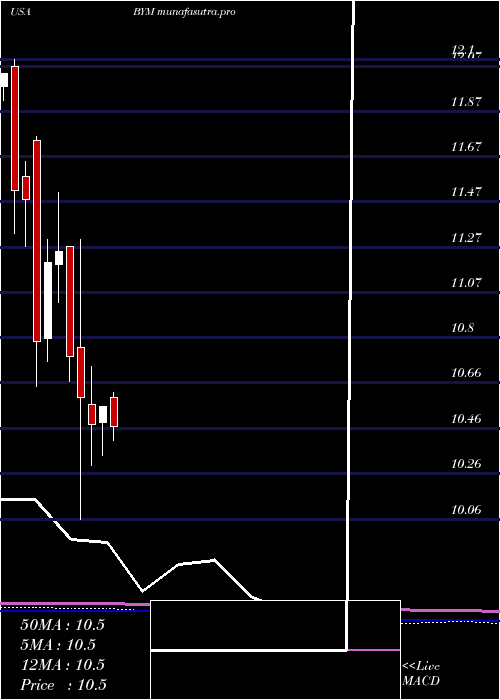
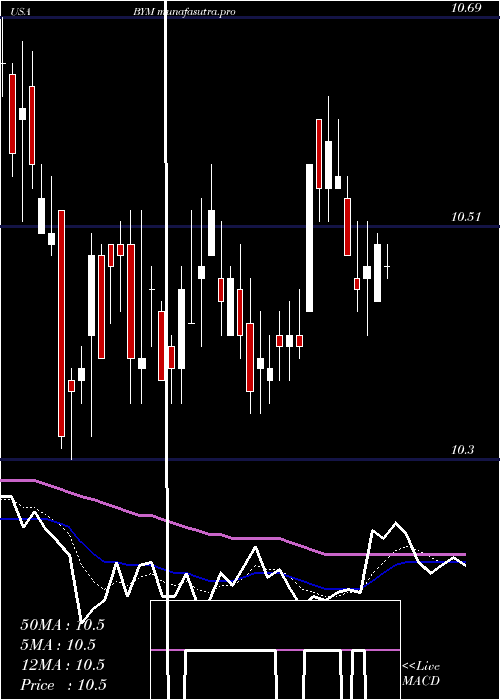
DMA SMA EMA moving averages of Blackrock Municipal BYM
DMA (daily moving average) of Blackrock Municipal BYM
| DMA period | DMA value | | 5 day DMA | 11.02 | | 12 day DMA | 10.98 | | 20 day DMA | 10.96 | | 35 day DMA | 10.92 | | 50 day DMA | 10.8 | | 100 day DMA | 10.62 | | 150 day DMA | 10.61 | | 200 day DMA | 10.74 | EMA (exponential moving average) of Blackrock Municipal BYM
| EMA period | EMA current | EMA prev | EMA prev2 | | 5 day EMA | 11 | 11 | 11.02 | | 12 day EMA | 11 | 11 | 11 | | 20 day EMA | 10.95 | 10.95 | 10.95 | | 35 day EMA | 10.88 | 10.87 | 10.86 | | 50 day EMA | 10.8 | 10.79 | 10.78 |
SMA (simple moving average) of Blackrock Municipal BYM
| SMA period | SMA current | SMA prev | SMA prev2 | | 5 day SMA | 11.02 | 11.03 | 11.03 | | 12 day SMA | 10.98 | 10.97 | 10.98 | | 20 day SMA | 10.96 | 10.96 | 10.96 | | 35 day SMA | 10.92 | 10.91 | 10.9 | | 50 day SMA | 10.8 | 10.79 | 10.78 | | 100 day SMA | 10.62 | 10.61 | 10.61 | | 150 day SMA | 10.61 | 10.61 | 10.61 | | 200 day SMA | 10.74 | 10.74 | 10.74 |
|
|
