BroadwayFinancial BYFC full analysis,charts,indicators,moving averages,SMA,DMA,EMA,ADX,MACD,RSIBroadway Financial BYFC WideScreen charts, DMA,SMA,EMA technical analysis, forecast prediction, by indicators ADX,MACD,RSI,CCI USA stock exchange
operates under Finance sector & deals in Savings Institutions
Daily price and charts and targets BroadwayFinancial Strong Daily Stock price targets for BroadwayFinancial BYFC are 6.75 and 6.76 | Daily Target 1 | 6.74 | | Daily Target 2 | 6.75 | | Daily Target 3 | 6.7533333333333 | | Daily Target 4 | 6.76 | | Daily Target 5 | 6.76 |
Daily price and volume Broadway Financial
| Date |
Closing |
Open |
Range |
Volume |
Tue 21 October 2025 |
6.75 (0%) |
6.76 |
6.75 - 6.76 |
0.5541 times |
Mon 20 October 2025 |
6.75 (-2.6%) |
6.76 |
6.75 - 6.76 |
0.3166 times |
Fri 17 October 2025 |
6.93 (-1.14%) |
6.77 |
6.76 - 6.93 |
0.4485 times |
Thu 16 October 2025 |
7.01 (-1.41%) |
7.17 |
7.01 - 7.17 |
0.9235 times |
Wed 15 October 2025 |
7.11 (0.28%) |
7.09 |
7.09 - 7.13 |
0.7124 times |
Tue 14 October 2025 |
7.09 (-1.66%) |
7.21 |
7.06 - 7.21 |
2.5858 times |
Mon 13 October 2025 |
7.21 (-1.37%) |
7.52 |
7.21 - 7.52 |
1.1082 times |
Fri 10 October 2025 |
7.31 (-2.79%) |
7.39 |
7.31 - 7.39 |
0.6069 times |
Thu 09 October 2025 |
7.52 (-2.21%) |
7.68 |
7.51 - 7.68 |
2.19 times |
Wed 08 October 2025 |
7.69 (1.05%) |
7.70 |
7.69 - 7.71 |
0.5541 times |
Tue 07 October 2025 |
7.61 (-1.3%) |
7.61 |
7.61 - 7.61 |
0.4749 times |
Weekly price and charts BroadwayFinancial Strong weekly Stock price targets for BroadwayFinancial BYFC are 6.75 and 6.76 | Weekly Target 1 | 6.74 | | Weekly Target 2 | 6.75 | | Weekly Target 3 | 6.7533333333333 | | Weekly Target 4 | 6.76 | | Weekly Target 5 | 6.76 |
Weekly price and volumes for Broadway Financial
| Date |
Closing |
Open |
Range |
Volume |
Tue 21 October 2025 |
6.75 (-2.6%) |
6.76 |
6.75 - 6.76 |
0.3725 times |
Fri 17 October 2025 |
6.93 (-5.2%) |
7.52 |
6.76 - 7.52 |
2.4721 times |
Fri 10 October 2025 |
7.31 (-3.82%) |
7.69 |
7.31 - 7.84 |
2.235 times |
Fri 03 October 2025 |
7.60 (2.56%) |
7.36 |
7.18 - 7.85 |
0.8341 times |
Fri 26 September 2025 |
7.41 (1.09%) |
7.33 |
7.25 - 7.41 |
0.3499 times |
Fri 19 September 2025 |
7.33 (-1.48%) |
7.78 |
7.12 - 7.81 |
1.6481 times |
Fri 12 September 2025 |
7.44 (-4%) |
7.70 |
7.26 - 7.76 |
0.9256 times |
Fri 05 September 2025 |
7.75 (-3.25%) |
7.75 |
7.75 - 7.75 |
0.079 times |
Fri 29 August 2025 |
8.01 (0%) |
8.00 |
8.00 - 8.01 |
0.0452 times |
Fri 29 August 2025 |
8.01 (9.58%) |
7.31 |
7.31 - 8.01 |
1.0385 times |
Fri 22 August 2025 |
7.31 (-3.18%) |
7.46 |
7.26 - 7.50 |
1.3997 times |

Monthly price and charts BroadwayFinancial Strong monthly Stock price targets for BroadwayFinancial BYFC are 6.2 and 7.3 | Monthly Target 1 | 6.02 | | Monthly Target 2 | 6.38 | | Monthly Target 3 | 7.1166666666667 | | Monthly Target 4 | 7.48 | | Monthly Target 5 | 8.22 |
Monthly price and volumes Broadway Financial
| Date |
Closing |
Open |
Range |
Volume |
Tue 21 October 2025 |
6.75 (-7.02%) |
7.18 |
6.75 - 7.85 |
0.467 times |
Mon 29 September 2025 |
7.26 (-9.36%) |
7.75 |
7.12 - 7.81 |
0.2467 times |
Fri 29 August 2025 |
8.01 (-2.2%) |
8.16 |
7.26 - 8.60 |
0.6487 times |
Thu 31 July 2025 |
8.19 (12.97%) |
7.31 |
6.98 - 8.85 |
2.1896 times |
Mon 30 June 2025 |
7.25 (15.08%) |
6.26 |
5.92 - 7.30 |
1.237 times |
Fri 30 May 2025 |
6.30 (-3.08%) |
6.32 |
6.11 - 7.10 |
1.1809 times |
Wed 30 April 2025 |
6.50 (-9.34%) |
7.15 |
5.71 - 7.54 |
1.5295 times |
Mon 31 March 2025 |
7.17 (-5.53%) |
7.47 |
6.90 - 7.89 |
0.5478 times |
Fri 28 February 2025 |
7.59 (-1.56%) |
7.56 |
7.26 - 8.00 |
0.4653 times |
Fri 31 January 2025 |
7.71 (12.55%) |
6.82 |
6.72 - 9.46 |
1.4875 times |
Tue 31 December 2024 |
6.85 (-0.72%) |
7.19 |
6.73 - 7.42 |
0.6563 times |

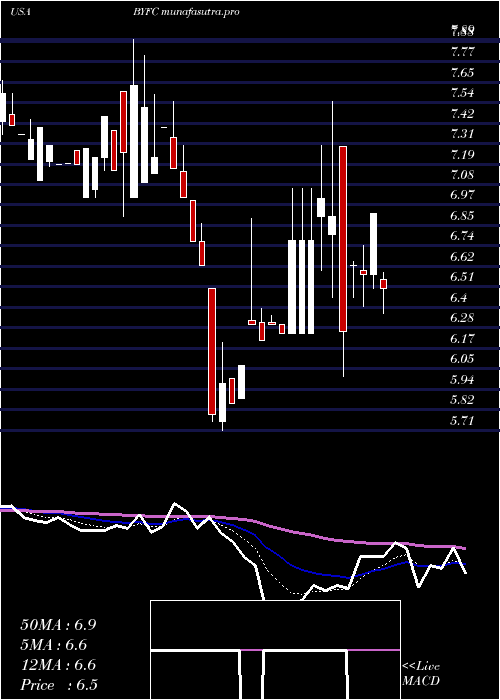
DMA SMA EMA moving averages of Broadway Financial BYFC
DMA (daily moving average) of Broadway Financial BYFC
| DMA period | DMA value | | 5 day DMA | 6.91 | | 12 day DMA | 7.22 | | 20 day DMA | 7.27 | | 35 day DMA | 7.4 | | 50 day DMA | 7.52 | | 100 day DMA | 7.19 | | 150 day DMA | 7.1 | | 200 day DMA | 7.2 | EMA (exponential moving average) of Broadway Financial BYFC
| EMA period | EMA current | EMA prev | EMA prev2 | | 5 day EMA | 6.9 | 6.97 | 7.08 | | 12 day EMA | 7.1 | 7.16 | 7.23 | | 20 day EMA | 7.21 | 7.26 | 7.31 | | 35 day EMA | 7.38 | 7.42 | 7.46 | | 50 day EMA | 7.52 | 7.55 | 7.58 |
SMA (simple moving average) of Broadway Financial BYFC
| SMA period | SMA current | SMA prev | SMA prev2 | | 5 day SMA | 6.91 | 6.98 | 7.07 | | 12 day SMA | 7.22 | 7.3 | 7.33 | | 20 day SMA | 7.27 | 7.29 | 7.31 | | 35 day SMA | 7.4 | 7.41 | 7.43 | | 50 day SMA | 7.52 | 7.55 | 7.58 | | 100 day SMA | 7.19 | 7.18 | 7.18 | | 150 day SMA | 7.1 | 7.1 | 7.1 | | 200 day SMA | 7.2 | 7.2 | 7.2 |
|
|
