BylineBancorp BY full analysis,charts,indicators,moving averages,SMA,DMA,EMA,ADX,MACD,RSIByline Bancorp BY WideScreen charts, DMA,SMA,EMA technical analysis, forecast prediction, by indicators ADX,MACD,RSI,CCI USA stock exchange
operates under Finance sector & deals in Major Banks
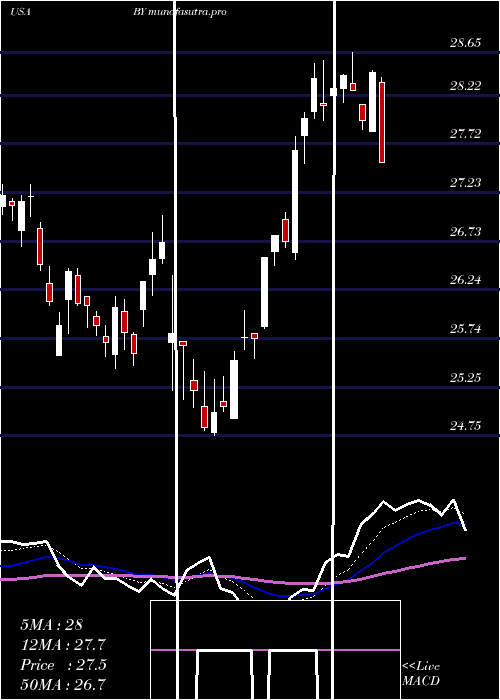
Daily price and charts and targets BylineBancorp Strong Daily Stock price targets for BylineBancorp BY are 29.12 and 29.52 | Daily Target 1 | 28.82 | | Daily Target 2 | 29.01 | | Daily Target 3 | 29.22 | | Daily Target 4 | 29.41 | | Daily Target 5 | 29.62 |
Daily price and volume Byline Bancorp
| Date |
Closing |
Open |
Range |
Volume |
Thu 04 December 2025 |
29.20 (0%) |
29.03 |
29.03 - 29.43 |
0.859 times |
Wed 03 December 2025 |
29.20 (2.82%) |
28.40 |
28.34 - 29.20 |
0.9105 times |
Tue 02 December 2025 |
28.40 (0.14%) |
28.50 |
28.25 - 28.72 |
1.2084 times |
Mon 01 December 2025 |
28.36 (1.58%) |
27.82 |
27.82 - 28.40 |
1.1629 times |
Fri 28 November 2025 |
27.92 (-0.71%) |
28.12 |
27.83 - 28.12 |
0.5123 times |
Wed 26 November 2025 |
28.12 (-0.81%) |
28.12 |
28.06 - 28.29 |
0.6228 times |
Tue 25 November 2025 |
28.35 (3.28%) |
27.86 |
27.45 - 28.45 |
1.0014 times |
Mon 24 November 2025 |
27.45 (-0.58%) |
27.54 |
27.32 - 27.63 |
1.0423 times |
Fri 21 November 2025 |
27.61 (2.53%) |
27.08 |
27.07 - 27.90 |
1.621 times |
Thu 20 November 2025 |
26.93 (0.71%) |
27.01 |
26.86 - 27.35 |
1.0594 times |
Wed 19 November 2025 |
26.74 (1.13%) |
26.44 |
26.42 - 26.90 |
0.717 times |
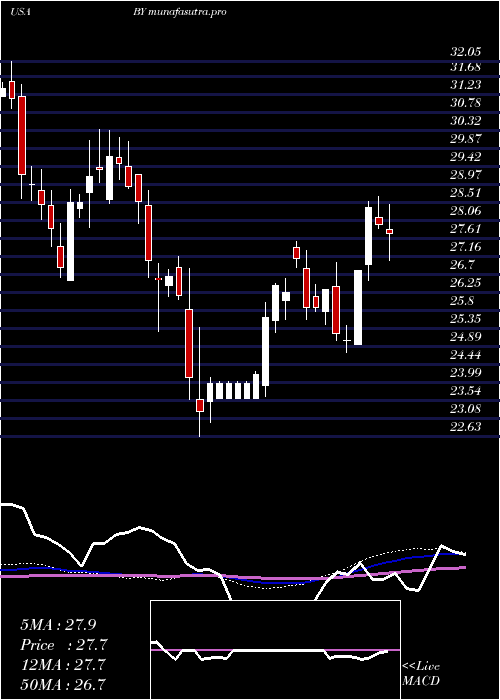
Weekly price and charts BylineBancorp Strong weekly Stock price targets for BylineBancorp BY are 28.51 and 30.12 | Weekly Target 1 | 27.21 | | Weekly Target 2 | 28.2 | | Weekly Target 3 | 28.816666666667 | | Weekly Target 4 | 29.81 | | Weekly Target 5 | 30.43 |
Weekly price and volumes for Byline Bancorp
| Date |
Closing |
Open |
Range |
Volume |
Thu 04 December 2025 |
29.20 (4.58%) |
27.82 |
27.82 - 29.43 |
1.0928 times |
Fri 28 November 2025 |
27.92 (1.12%) |
27.54 |
27.32 - 28.45 |
0.8389 times |
Fri 21 November 2025 |
27.61 (0.33%) |
27.52 |
26.42 - 27.90 |
1.4061 times |
Fri 14 November 2025 |
27.52 (0.95%) |
27.67 |
26.95 - 27.75 |
1.1276 times |
Fri 07 November 2025 |
27.26 (1.94%) |
26.55 |
26.43 - 27.43 |
0.8322 times |
Fri 31 October 2025 |
26.74 (0%) |
26.58 |
26.39 - 26.81 |
0.2146 times |
Fri 31 October 2025 |
26.74 (-5.01%) |
28.40 |
26.39 - 28.40 |
1.32 times |
Fri 24 October 2025 |
28.15 (7.48%) |
26.36 |
26.16 - 28.32 |
1.1551 times |
Fri 17 October 2025 |
26.19 (-0.83%) |
26.76 |
25.57 - 27.68 |
1.063 times |
Fri 10 October 2025 |
26.41 (-4.42%) |
27.93 |
26.39 - 28.38 |
0.9498 times |
Fri 03 October 2025 |
27.63 (-2.54%) |
28.42 |
27.12 - 28.42 |
1.0283 times |
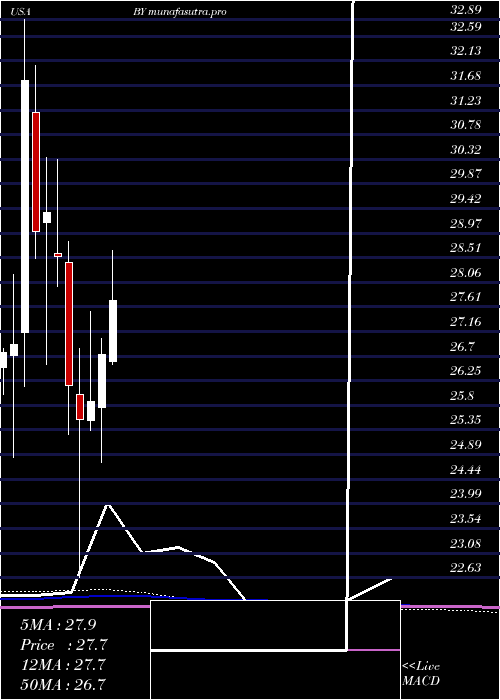
Monthly price and charts BylineBancorp Strong monthly Stock price targets for BylineBancorp BY are 28.51 and 30.12 | Monthly Target 1 | 27.21 | | Monthly Target 2 | 28.2 | | Monthly Target 3 | 28.816666666667 | | Monthly Target 4 | 29.81 | | Monthly Target 5 | 30.43 |
Monthly price and volumes Byline Bancorp
| Date |
Closing |
Open |
Range |
Volume |
Thu 04 December 2025 |
29.20 (4.58%) |
27.82 |
27.82 - 29.43 |
0.224 times |
Fri 28 November 2025 |
27.92 (4.41%) |
26.55 |
26.42 - 28.45 |
0.8617 times |
Fri 31 October 2025 |
26.74 (-3.57%) |
27.51 |
25.57 - 28.40 |
1.0649 times |
Tue 30 September 2025 |
27.73 (-4.08%) |
28.58 |
27.42 - 29.75 |
1.321 times |
Fri 29 August 2025 |
28.91 (9.92%) |
26.14 |
25.38 - 29.49 |
1.0169 times |
Thu 31 July 2025 |
26.30 (-1.61%) |
26.61 |
26.23 - 28.65 |
1.3014 times |
Mon 30 June 2025 |
26.73 (3.32%) |
25.76 |
24.75 - 27.02 |
1.7056 times |
Fri 30 May 2025 |
25.87 (1.29%) |
25.52 |
25.34 - 27.52 |
0.7049 times |
Wed 30 April 2025 |
25.54 (-2.37%) |
26.00 |
22.63 - 26.85 |
1.0955 times |
Mon 31 March 2025 |
26.16 (-8.34%) |
28.43 |
25.27 - 28.81 |
0.704 times |
Fri 28 February 2025 |
28.54 (-2.73%) |
28.59 |
27.98 - 30.31 |
0.4909 times |
DMA SMA EMA moving averages of Byline Bancorp BY
DMA (daily moving average) of Byline Bancorp BY
| DMA period | DMA value | | 5 day DMA | 28.62 | | 12 day DMA | 27.89 | | 20 day DMA | 27.64 | | 35 day DMA | 27.32 | | 50 day DMA | 27.39 | | 100 day DMA | 27.64 | | 150 day DMA | 27.28 | | 200 day DMA | 26.93 | EMA (exponential moving average) of Byline Bancorp BY
| EMA period | EMA current | EMA prev | EMA prev2 | | 5 day EMA | 28.73 | 28.49 | 28.13 | | 12 day EMA | 28.18 | 27.99 | 27.77 | | 20 day EMA | 27.87 | 27.73 | 27.58 | | 35 day EMA | 27.69 | 27.6 | 27.51 | | 50 day EMA | 27.61 | 27.55 | 27.48 |
SMA (simple moving average) of Byline Bancorp BY
| SMA period | SMA current | SMA prev | SMA prev2 | | 5 day SMA | 28.62 | 28.4 | 28.23 | | 12 day SMA | 27.89 | 27.67 | 27.53 | | 20 day SMA | 27.64 | 27.54 | 27.42 | | 35 day SMA | 27.32 | 27.26 | 27.21 | | 50 day SMA | 27.39 | 27.37 | 27.35 | | 100 day SMA | 27.64 | 27.63 | 27.62 | | 150 day SMA | 27.28 | 27.26 | 27.24 | | 200 day SMA | 26.93 | 26.93 | 26.93 |
|
|
