BlackstoneGroup BX full analysis,charts,indicators,moving averages,SMA,DMA,EMA,ADX,MACD,RSIBlackstone Group BX WideScreen charts, DMA,SMA,EMA technical analysis, forecast prediction, by indicators ADX,MACD,RSI,CCI USA stock exchange
operates under Finance sector & deals in Investment Managers
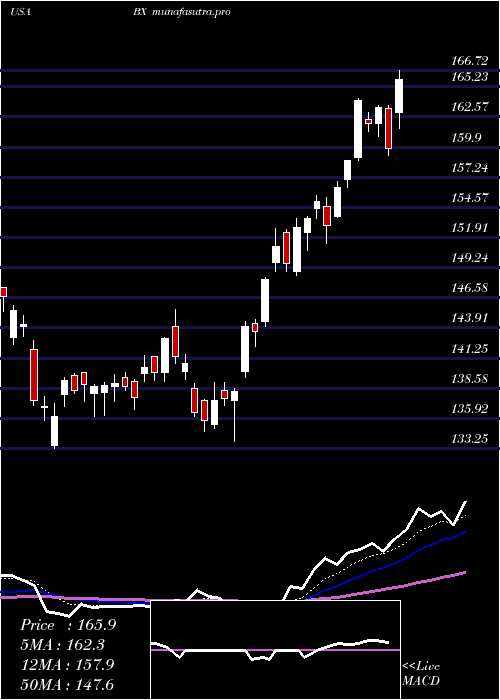
Daily price and charts and targets BlackstoneGroup Strong Daily Stock price targets for BlackstoneGroup BX are 149.48 and 152.16 | Daily Target 1 | 148.84 | | Daily Target 2 | 150.11 | | Daily Target 3 | 151.51666666667 | | Daily Target 4 | 152.79 | | Daily Target 5 | 154.2 |
Daily price and volume Blackstone Group
| Date |
Closing |
Open |
Range |
Volume |
Thu 04 December 2025 |
151.39 (-0.09%) |
151.97 |
150.24 - 152.92 |
0.4922 times |
Wed 03 December 2025 |
151.52 (3.26%) |
147.16 |
146.40 - 151.82 |
1.1089 times |
Tue 02 December 2025 |
146.74 (0.27%) |
147.83 |
146.16 - 147.90 |
0.3972 times |
Mon 01 December 2025 |
146.35 (-0.05%) |
144.09 |
143.21 - 147.90 |
0.9431 times |
Fri 28 November 2025 |
146.42 (1.04%) |
146.14 |
145.50 - 147.78 |
0.4904 times |
Wed 26 November 2025 |
144.92 (1.04%) |
143.44 |
143.11 - 146.18 |
0.9397 times |
Tue 25 November 2025 |
143.43 (1.42%) |
141.80 |
140.69 - 144.48 |
1.0571 times |
Mon 24 November 2025 |
141.42 (-0.88%) |
142.43 |
141.09 - 143.61 |
1.4615 times |
Fri 21 November 2025 |
142.67 (3.07%) |
139.67 |
137.88 - 143.16 |
1.4508 times |
Thu 20 November 2025 |
138.42 (-0.17%) |
141.00 |
137.66 - 142.06 |
1.6593 times |
Wed 19 November 2025 |
138.65 (1.55%) |
137.25 |
135.44 - 138.71 |
1.5501 times |
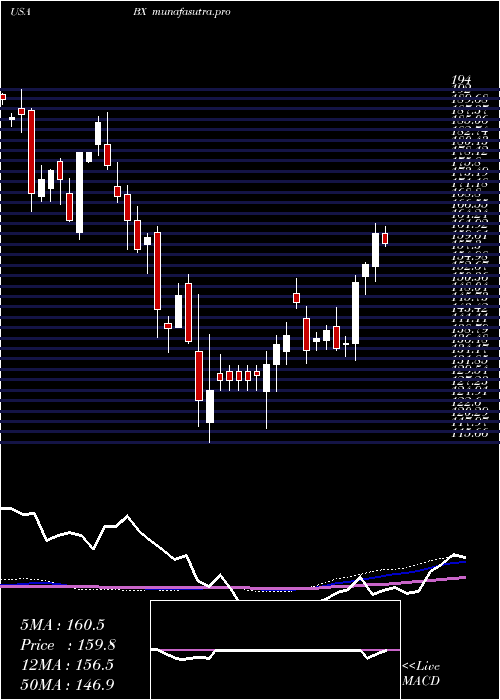
Weekly price and charts BlackstoneGroup Strong weekly Stock price targets for BlackstoneGroup BX are 147.3 and 157.01 | Weekly Target 1 | 139.46 | | Weekly Target 2 | 145.43 | | Weekly Target 3 | 149.17333333333 | | Weekly Target 4 | 155.14 | | Weekly Target 5 | 158.88 |
Weekly price and volumes for Blackstone Group
| Date |
Closing |
Open |
Range |
Volume |
Thu 04 December 2025 |
151.39 (3.39%) |
144.09 |
143.21 - 152.92 |
0.5862 times |
Fri 28 November 2025 |
146.42 (2.63%) |
142.43 |
140.69 - 147.78 |
0.787 times |
Fri 21 November 2025 |
142.67 (0.87%) |
140.71 |
135.44 - 143.16 |
1.4853 times |
Fri 14 November 2025 |
141.44 (-3.1%) |
148.13 |
136.89 - 149.00 |
1.5159 times |
Fri 07 November 2025 |
145.97 (-0.46%) |
142.00 |
141.11 - 146.24 |
0.8056 times |
Fri 31 October 2025 |
146.64 (0%) |
147.67 |
144.54 - 147.96 |
0.37 times |
Fri 31 October 2025 |
146.64 (-5.16%) |
155.28 |
144.54 - 157.85 |
1.3433 times |
Fri 24 October 2025 |
154.62 (-1.08%) |
158.07 |
152.22 - 165.47 |
0.8401 times |
Fri 17 October 2025 |
156.31 (1.65%) |
156.41 |
154.44 - 166.39 |
1.249 times |
Fri 10 October 2025 |
153.77 (-8.71%) |
169.21 |
153.16 - 170.00 |
1.0175 times |
Fri 03 October 2025 |
168.45 (-3.92%) |
176.38 |
166.40 - 177.23 |
1.0428 times |
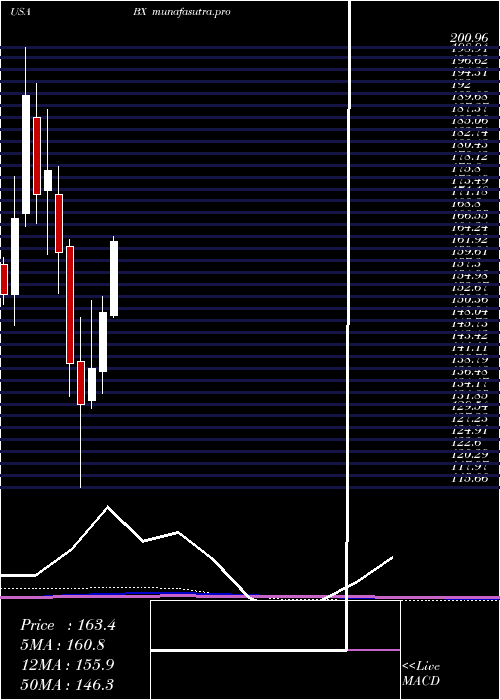
Monthly price and charts BlackstoneGroup Strong monthly Stock price targets for BlackstoneGroup BX are 147.3 and 157.01 | Monthly Target 1 | 139.46 | | Monthly Target 2 | 145.43 | | Monthly Target 3 | 149.17333333333 | | Monthly Target 4 | 155.14 | | Monthly Target 5 | 158.88 |
Monthly price and volumes Blackstone Group
| Date |
Closing |
Open |
Range |
Volume |
Thu 04 December 2025 |
151.39 (3.39%) |
144.09 |
143.21 - 152.92 |
0.1222 times |
Fri 28 November 2025 |
146.42 (-0.15%) |
142.00 |
135.44 - 149.00 |
0.9578 times |
Fri 31 October 2025 |
146.64 (-14.17%) |
169.36 |
144.54 - 170.45 |
1.1219 times |
Tue 30 September 2025 |
170.85 (-0.32%) |
167.63 |
165.32 - 190.09 |
0.9672 times |
Fri 29 August 2025 |
171.40 (-0.9%) |
169.95 |
162.69 - 177.41 |
0.9171 times |
Thu 31 July 2025 |
172.96 (15.63%) |
148.94 |
148.58 - 181.32 |
1.0942 times |
Mon 30 June 2025 |
149.58 (7.8%) |
138.17 |
133.84 - 152.67 |
0.8208 times |
Fri 30 May 2025 |
138.76 (5.35%) |
132.48 |
130.96 - 152.00 |
0.9765 times |
Wed 30 April 2025 |
131.71 (-5.77%) |
140.12 |
115.66 - 148.57 |
1.8061 times |
Mon 31 March 2025 |
139.78 (-13.27%) |
162.32 |
133.23 - 163.66 |
1.2162 times |
Fri 28 February 2025 |
161.16 (-9.01%) |
172.43 |
153.16 - 177.78 |
0.8756 times |
DMA SMA EMA moving averages of Blackstone Group BX
DMA (daily moving average) of Blackstone Group BX
| DMA period | DMA value | | 5 day DMA | 148.48 | | 12 day DMA | 144.04 | | 20 day DMA | 143.54 | | 35 day DMA | 147.47 | | 50 day DMA | 153.15 | | 100 day DMA | 163.47 | | 150 day DMA | 157.06 | | 200 day DMA | 152.88 | EMA (exponential moving average) of Blackstone Group BX
| EMA period | EMA current | EMA prev | EMA prev2 | | 5 day EMA | 148.76 | 147.45 | 145.41 | | 12 day EMA | 146.17 | 145.22 | 144.07 | | 20 day EMA | 146.3 | 145.76 | 145.15 | | 35 day EMA | 150.29 | 150.22 | 150.14 | | 50 day EMA | 155.32 | 155.48 | 155.64 |
SMA (simple moving average) of Blackstone Group BX
| SMA period | SMA current | SMA prev | SMA prev2 | | 5 day SMA | 148.48 | 147.19 | 145.57 | | 12 day SMA | 144.04 | 142.96 | 142.12 | | 20 day SMA | 143.54 | 143.19 | 142.76 | | 35 day SMA | 147.47 | 147.83 | 148.19 | | 50 day SMA | 153.15 | 153.68 | 154.35 | | 100 day SMA | 163.47 | 163.55 | 163.67 | | 150 day SMA | 157.06 | 156.93 | 156.81 | | 200 day SMA | 152.88 | 152.96 | 153.03 |
|
|
