FirstBusey BUSE full analysis,charts,indicators,moving averages,SMA,DMA,EMA,ADX,MACD,RSIFirst Busey BUSE WideScreen charts, DMA,SMA,EMA technical analysis, forecast prediction, by indicators ADX,MACD,RSI,CCI USA stock exchange
operates under Finance sector & deals in Major Banks
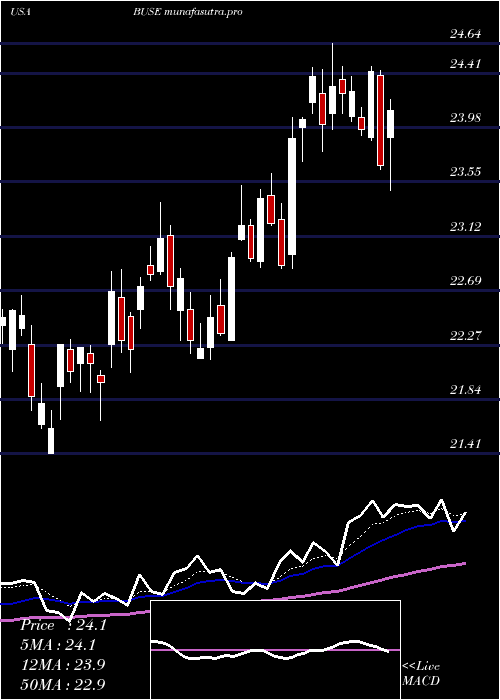
Daily price and charts and targets FirstBusey Strong Daily Stock price targets for FirstBusey BUSE are 24.03 and 24.45 | Daily Target 1 | 23.7 | | Daily Target 2 | 23.94 | | Daily Target 3 | 24.12 | | Daily Target 4 | 24.36 | | Daily Target 5 | 24.54 |
Daily price and volume First Busey
| Date |
Closing |
Open |
Range |
Volume |
Thu 04 December 2025 |
24.18 (1%) |
24.12 |
23.88 - 24.30 |
0.9131 times |
Wed 03 December 2025 |
23.94 (1.87%) |
23.62 |
23.27 - 24.08 |
0.9572 times |
Tue 02 December 2025 |
23.50 (-0.09%) |
23.71 |
23.48 - 23.78 |
0.7497 times |
Mon 01 December 2025 |
23.52 (-0.08%) |
23.30 |
23.30 - 23.92 |
1.9559 times |
Fri 28 November 2025 |
23.54 (-0.93%) |
23.97 |
23.49 - 23.97 |
0.5418 times |
Wed 26 November 2025 |
23.76 (-0.88%) |
23.79 |
23.71 - 23.95 |
1.4885 times |
Tue 25 November 2025 |
23.97 (3.27%) |
23.37 |
23.37 - 24.07 |
0.8932 times |
Mon 24 November 2025 |
23.21 (0%) |
23.19 |
22.93 - 23.35 |
0.8333 times |
Fri 21 November 2025 |
23.21 (3.52%) |
22.50 |
22.43 - 23.49 |
0.9199 times |
Thu 20 November 2025 |
22.42 (-0.36%) |
22.75 |
22.37 - 23.03 |
0.7475 times |
Wed 19 November 2025 |
22.50 (0.67%) |
22.34 |
22.30 - 22.61 |
0.7204 times |
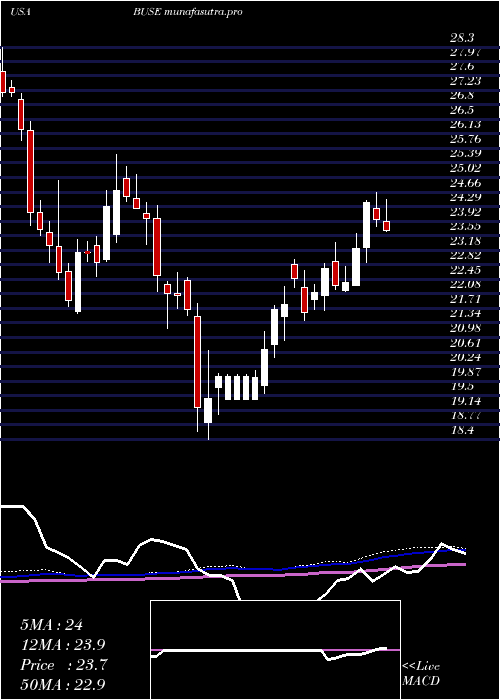
Weekly price and charts FirstBusey Strong weekly Stock price targets for FirstBusey BUSE are 23.73 and 24.76 | Weekly Target 1 | 22.89 | | Weekly Target 2 | 23.53 | | Weekly Target 3 | 23.916666666667 | | Weekly Target 4 | 24.56 | | Weekly Target 5 | 24.95 |
Weekly price and volumes for First Busey
| Date |
Closing |
Open |
Range |
Volume |
Thu 04 December 2025 |
24.18 (2.72%) |
23.30 |
23.27 - 24.30 |
1.0541 times |
Fri 28 November 2025 |
23.54 (1.42%) |
23.19 |
22.93 - 24.07 |
0.8654 times |
Fri 21 November 2025 |
23.21 (0.22%) |
23.06 |
22.12 - 23.49 |
1.0245 times |
Fri 14 November 2025 |
23.16 (0.74%) |
23.03 |
22.70 - 23.44 |
0.9309 times |
Fri 07 November 2025 |
22.99 (2.82%) |
22.51 |
22.30 - 23.19 |
0.8415 times |
Fri 31 October 2025 |
22.36 (0%) |
22.27 |
22.12 - 22.54 |
0.2325 times |
Fri 31 October 2025 |
22.36 (-4.77%) |
23.40 |
22.12 - 23.59 |
1.3949 times |
Fri 24 October 2025 |
23.48 (4.49%) |
22.48 |
22.47 - 23.60 |
1.0141 times |
Fri 17 October 2025 |
22.47 (0.04%) |
22.80 |
22.00 - 23.96 |
1.3765 times |
Fri 10 October 2025 |
22.46 (-3.06%) |
23.31 |
22.42 - 23.70 |
1.2655 times |
Fri 03 October 2025 |
23.17 (-3.46%) |
23.92 |
22.73 - 24.19 |
1.3078 times |
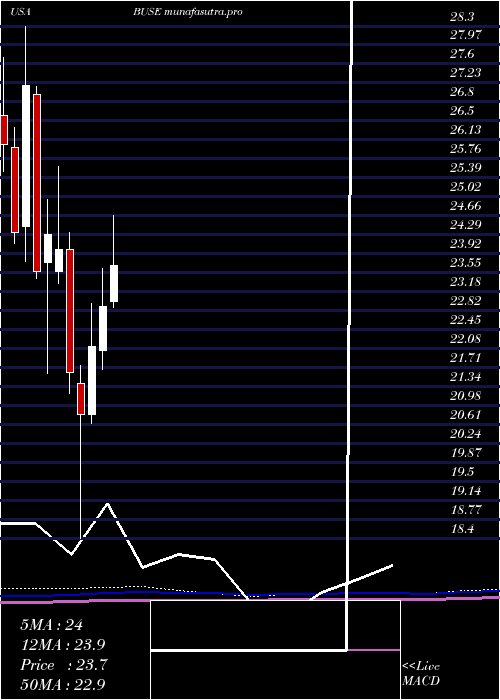
Monthly price and charts FirstBusey Strong monthly Stock price targets for FirstBusey BUSE are 23.73 and 24.76 | Monthly Target 1 | 22.89 | | Monthly Target 2 | 23.53 | | Monthly Target 3 | 23.916666666667 | | Monthly Target 4 | 24.56 | | Monthly Target 5 | 24.95 |
Monthly price and volumes First Busey
| Date |
Closing |
Open |
Range |
Volume |
Thu 04 December 2025 |
24.18 (2.72%) |
23.30 |
23.27 - 24.30 |
0.1893 times |
Fri 28 November 2025 |
23.54 (5.28%) |
22.51 |
22.12 - 24.07 |
0.6578 times |
Fri 31 October 2025 |
22.36 (-3.41%) |
23.00 |
22.00 - 23.96 |
1.0832 times |
Tue 30 September 2025 |
23.15 (-6.28%) |
24.42 |
22.93 - 25.18 |
1.1818 times |
Fri 29 August 2025 |
24.70 (10.66%) |
22.01 |
21.63 - 24.98 |
1.0465 times |
Thu 31 July 2025 |
22.32 (-2.49%) |
22.98 |
22.26 - 24.64 |
1.2848 times |
Mon 30 June 2025 |
22.89 (3.48%) |
22.03 |
21.67 - 23.62 |
1.252 times |
Fri 30 May 2025 |
22.12 (6.4%) |
20.79 |
20.61 - 22.94 |
0.9447 times |
Wed 30 April 2025 |
20.79 (-3.75%) |
21.40 |
18.40 - 21.75 |
1.4145 times |
Mon 31 March 2025 |
21.60 (-9.96%) |
23.99 |
21.21 - 24.32 |
0.9452 times |
Fri 28 February 2025 |
23.99 (-1.19%) |
23.57 |
23.33 - 25.60 |
0.8528 times |
DMA SMA EMA moving averages of First Busey BUSE
DMA (daily moving average) of First Busey BUSE
| DMA period | DMA value | | 5 day DMA | 23.74 | | 12 day DMA | 23.34 | | 20 day DMA | 23.16 | | 35 day DMA | 23.04 | | 50 day DMA | 23.12 | | 100 day DMA | 23.47 | | 150 day DMA | 23.22 | | 200 day DMA | 22.8 | EMA (exponential moving average) of First Busey BUSE
| EMA period | EMA current | EMA prev | EMA prev2 | | 5 day EMA | 23.82 | 23.64 | 23.49 | | 12 day EMA | 23.5 | 23.38 | 23.28 | | 20 day EMA | 23.33 | 23.24 | 23.17 | | 35 day EMA | 23.3 | 23.25 | 23.21 | | 50 day EMA | 23.3 | 23.26 | 23.23 |
SMA (simple moving average) of First Busey BUSE
| SMA period | SMA current | SMA prev | SMA prev2 | | 5 day SMA | 23.74 | 23.65 | 23.66 | | 12 day SMA | 23.34 | 23.17 | 23.11 | | 20 day SMA | 23.16 | 23.11 | 23.04 | | 35 day SMA | 23.04 | 23.01 | 23.01 | | 50 day SMA | 23.12 | 23.12 | 23.12 | | 100 day SMA | 23.47 | 23.47 | 23.47 | | 150 day SMA | 23.22 | 23.2 | 23.18 | | 200 day SMA | 22.8 | 22.8 | 22.81 |
|
|
