BlackrockCredit BTZ full analysis,charts,indicators,moving averages,SMA,DMA,EMA,ADX,MACD,RSIBlackrock Credit BTZ WideScreen charts, DMA,SMA,EMA technical analysis, forecast prediction, by indicators ADX,MACD,RSI,CCI USA stock exchange
operates under N A sector & deals in N A
Daily price and charts and targets BlackrockCredit Strong Daily Stock price targets for BlackrockCredit BTZ are 10.8 and 10.89 | Daily Target 1 | 10.78 | | Daily Target 2 | 10.82 | | Daily Target 3 | 10.87 | | Daily Target 4 | 10.91 | | Daily Target 5 | 10.96 |
Daily price and volume Blackrock Credit
| Date |
Closing |
Open |
Range |
Volume |
Thu 04 December 2025 |
10.86 (-0.46%) |
10.92 |
10.83 - 10.92 |
1.0479 times |
Wed 03 December 2025 |
10.91 (0.55%) |
10.86 |
10.82 - 10.91 |
0.9493 times |
Tue 02 December 2025 |
10.85 (-0.28%) |
10.93 |
10.80 - 10.93 |
1.3857 times |
Mon 01 December 2025 |
10.88 (-0.91%) |
10.92 |
10.86 - 10.97 |
1.193 times |
Fri 28 November 2025 |
10.98 (0.27%) |
10.99 |
10.92 - 11.04 |
0.785 times |
Wed 26 November 2025 |
10.95 (0.74%) |
10.90 |
10.89 - 10.96 |
0.7838 times |
Tue 25 November 2025 |
10.87 (0%) |
10.88 |
10.86 - 10.90 |
0.7946 times |
Mon 24 November 2025 |
10.87 (1.3%) |
10.78 |
10.76 - 10.87 |
1.0621 times |
Fri 21 November 2025 |
10.73 (0.19%) |
10.71 |
10.70 - 10.77 |
0.8331 times |
Thu 20 November 2025 |
10.71 (-0.74%) |
10.80 |
10.70 - 10.85 |
1.1653 times |
Wed 19 November 2025 |
10.79 (-0.55%) |
10.86 |
10.74 - 10.87 |
1.1874 times |
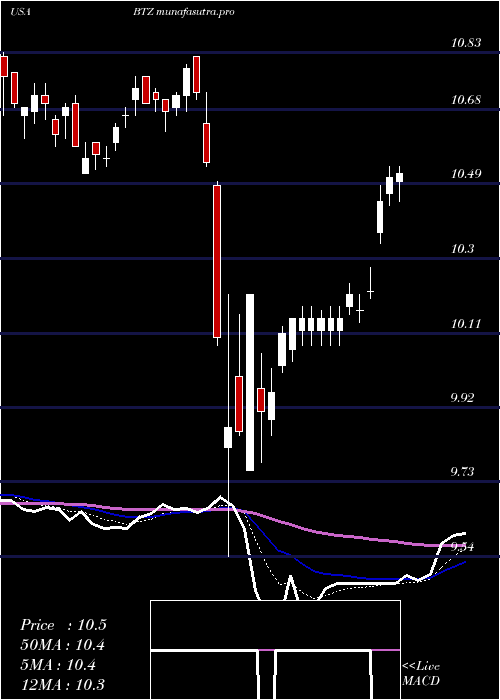
Weekly price and charts BlackrockCredit Strong weekly Stock price targets for BlackrockCredit BTZ are 10.75 and 10.92 | Weekly Target 1 | 10.71 | | Weekly Target 2 | 10.78 | | Weekly Target 3 | 10.876666666667 | | Weekly Target 4 | 10.95 | | Weekly Target 5 | 11.05 |
Weekly price and volumes for Blackrock Credit
| Date |
Closing |
Open |
Range |
Volume |
Thu 04 December 2025 |
10.86 (-1.09%) |
10.92 |
10.80 - 10.97 |
0.926 times |
Fri 28 November 2025 |
10.98 (2.33%) |
10.78 |
10.76 - 11.04 |
0.6932 times |
Fri 21 November 2025 |
10.73 (-0.65%) |
10.80 |
10.70 - 10.87 |
1.1239 times |
Fri 14 November 2025 |
10.80 (-2%) |
11.03 |
10.80 - 11.12 |
1.1974 times |
Fri 07 November 2025 |
11.02 (-1.34%) |
11.12 |
10.96 - 11.14 |
0.8829 times |
Fri 31 October 2025 |
11.17 (0%) |
11.17 |
11.12 - 11.18 |
0.3498 times |
Fri 31 October 2025 |
11.17 (0.36%) |
11.15 |
11.06 - 11.18 |
1.2551 times |
Fri 24 October 2025 |
11.13 (0.82%) |
11.06 |
11.00 - 11.16 |
1.1139 times |
Fri 17 October 2025 |
11.04 (0.27%) |
11.00 |
10.96 - 11.11 |
1.0169 times |
Fri 10 October 2025 |
11.01 (0.27%) |
10.99 |
10.95 - 11.14 |
1.4409 times |
Fri 03 October 2025 |
10.98 (0.27%) |
11.01 |
10.96 - 11.08 |
1.3251 times |
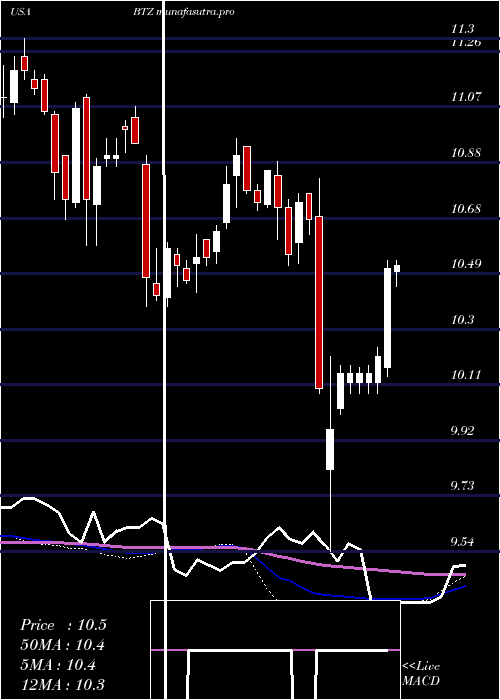
Monthly price and charts BlackrockCredit Strong monthly Stock price targets for BlackrockCredit BTZ are 10.75 and 10.92 | Monthly Target 1 | 10.71 | | Monthly Target 2 | 10.78 | | Monthly Target 3 | 10.876666666667 | | Monthly Target 4 | 10.95 | | Monthly Target 5 | 11.05 |
Monthly price and volumes Blackrock Credit
| Date |
Closing |
Open |
Range |
Volume |
Thu 04 December 2025 |
10.86 (-1.09%) |
10.92 |
10.80 - 10.97 |
0.1869 times |
Fri 28 November 2025 |
10.98 (-1.7%) |
11.12 |
10.70 - 11.14 |
0.7866 times |
Fri 31 October 2025 |
11.17 (1.09%) |
11.04 |
10.95 - 11.18 |
1.2187 times |
Tue 30 September 2025 |
11.05 (0.45%) |
10.90 |
10.90 - 11.18 |
1.1176 times |
Fri 29 August 2025 |
11.00 (-0.36%) |
11.00 |
10.83 - 11.15 |
0.9811 times |
Thu 31 July 2025 |
11.04 (1.1%) |
10.93 |
10.77 - 11.05 |
0.8745 times |
Mon 30 June 2025 |
10.92 (1.77%) |
10.67 |
10.63 - 10.95 |
0.7181 times |
Fri 30 May 2025 |
10.73 (1.32%) |
10.60 |
10.38 - 10.73 |
1.1497 times |
Wed 30 April 2025 |
10.59 (-1.21%) |
10.72 |
9.54 - 10.82 |
1.7704 times |
Mon 31 March 2025 |
10.72 (-1.2%) |
10.83 |
10.52 - 10.88 |
1.1964 times |
Fri 28 February 2025 |
10.85 (0.46%) |
10.83 |
10.71 - 10.96 |
1.0051 times |

DMA SMA EMA moving averages of Blackrock Credit BTZ
DMA (daily moving average) of Blackrock Credit BTZ
| DMA period | DMA value | | 5 day DMA | 10.9 | | 12 day DMA | 10.85 | | 20 day DMA | 10.91 | | 35 day DMA | 10.99 | | 50 day DMA | 11.01 | | 100 day DMA | 11.01 | | 150 day DMA | 10.91 | | 200 day DMA | 10.8 | EMA (exponential moving average) of Blackrock Credit BTZ
| EMA period | EMA current | EMA prev | EMA prev2 | | 5 day EMA | 10.88 | 10.89 | 10.88 | | 12 day EMA | 10.89 | 10.89 | 10.89 | | 20 day EMA | 10.91 | 10.92 | 10.92 | | 35 day EMA | 10.94 | 10.95 | 10.95 | | 50 day EMA | 10.99 | 11 | 11 |
SMA (simple moving average) of Blackrock Credit BTZ
| SMA period | SMA current | SMA prev | SMA prev2 | | 5 day SMA | 10.9 | 10.91 | 10.91 | | 12 day SMA | 10.85 | 10.85 | 10.84 | | 20 day SMA | 10.91 | 10.92 | 10.93 | | 35 day SMA | 10.99 | 11 | 11 | | 50 day SMA | 11.01 | 11.01 | 11.01 | | 100 day SMA | 11.01 | 11.01 | 11.01 | | 150 day SMA | 10.91 | 10.9 | 10.9 | | 200 day SMA | 10.8 | 10.8 | 10.8 |
|
|
