PeabodyEnergy BTU full analysis,charts,indicators,moving averages,SMA,DMA,EMA,ADX,MACD,RSIPeabody Energy BTU WideScreen charts, DMA,SMA,EMA technical analysis, forecast prediction, by indicators ADX,MACD,RSI,CCI USA stock exchange
operates under Energy sector & deals in Coal Mining
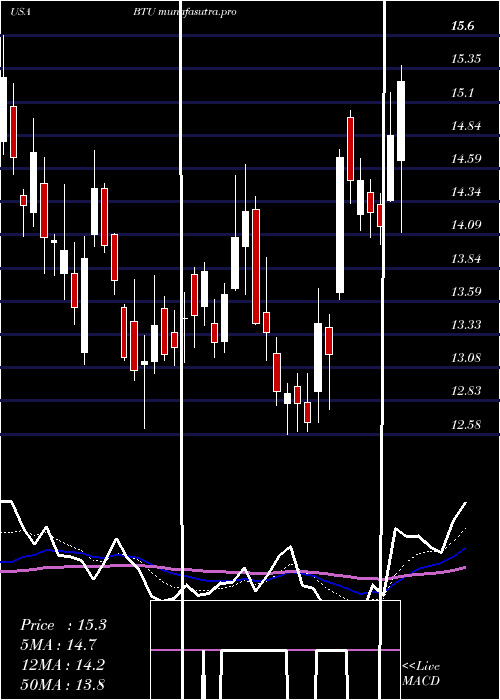
Daily price and charts and targets PeabodyEnergy Strong Daily Stock price targets for PeabodyEnergy BTU are 29.07 and 30.21 | Daily Target 1 | 28.16 | | Daily Target 2 | 28.83 | | Daily Target 3 | 29.296666666667 | | Daily Target 4 | 29.97 | | Daily Target 5 | 30.44 |
Daily price and volume Peabody Energy
| Date |
Closing |
Open |
Range |
Volume |
Thu 04 December 2025 |
29.51 (0.27%) |
29.25 |
28.62 - 29.76 |
0.8152 times |
Wed 03 December 2025 |
29.43 (6.71%) |
27.73 |
27.73 - 29.79 |
1.6603 times |
Tue 02 December 2025 |
27.58 (3.1%) |
27.09 |
26.95 - 28.19 |
1.1372 times |
Mon 01 December 2025 |
26.75 (-1.8%) |
27.09 |
26.59 - 27.76 |
0.9588 times |
Fri 28 November 2025 |
27.24 (0.96%) |
26.79 |
26.67 - 27.43 |
0.4098 times |
Wed 26 November 2025 |
26.98 (1.5%) |
26.70 |
26.67 - 27.48 |
0.7213 times |
Tue 25 November 2025 |
26.58 (1.8%) |
26.13 |
25.95 - 27.16 |
0.8611 times |
Mon 24 November 2025 |
26.11 (-0.95%) |
26.12 |
25.53 - 26.22 |
0.9132 times |
Fri 21 November 2025 |
26.36 (1.38%) |
25.97 |
25.46 - 26.66 |
1.0779 times |
Thu 20 November 2025 |
26.00 (-6.04%) |
28.17 |
25.85 - 28.24 |
1.4452 times |
Wed 19 November 2025 |
27.67 (-4.16%) |
28.71 |
27.22 - 29.25 |
1.1585 times |
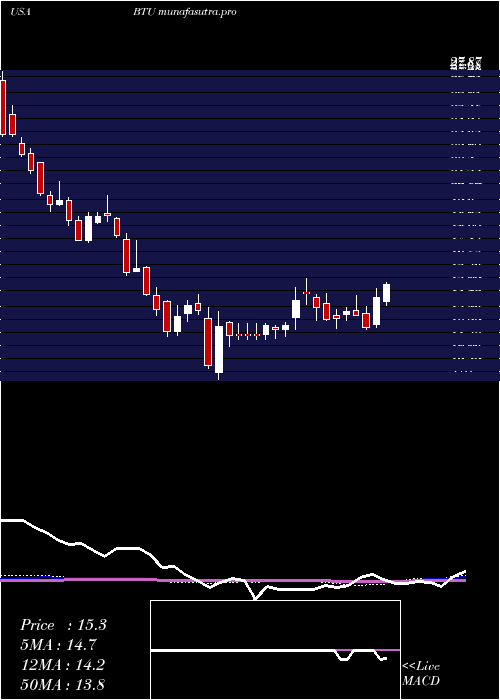
Weekly price and charts PeabodyEnergy Strong weekly Stock price targets for PeabodyEnergy BTU are 28.05 and 31.25 | Weekly Target 1 | 25.43 | | Weekly Target 2 | 27.47 | | Weekly Target 3 | 28.63 | | Weekly Target 4 | 30.67 | | Weekly Target 5 | 31.83 |
Weekly price and volumes for Peabody Energy
| Date |
Closing |
Open |
Range |
Volume |
Thu 04 December 2025 |
29.51 (8.33%) |
27.09 |
26.59 - 29.79 |
0.7046 times |
Fri 28 November 2025 |
27.24 (3.34%) |
26.12 |
25.53 - 27.48 |
0.4478 times |
Fri 21 November 2025 |
26.36 (-8.69%) |
28.67 |
25.46 - 29.44 |
0.8867 times |
Fri 14 November 2025 |
28.87 (-5%) |
31.10 |
28.04 - 31.15 |
0.896 times |
Fri 07 November 2025 |
30.39 (10.83%) |
28.78 |
27.78 - 31.16 |
0.6924 times |
Fri 31 October 2025 |
27.42 (0%) |
27.00 |
26.05 - 27.56 |
0.2651 times |
Fri 31 October 2025 |
27.42 (-5.45%) |
29.20 |
24.60 - 29.44 |
1.3121 times |
Fri 24 October 2025 |
29.00 (-7.5%) |
32.01 |
27.83 - 32.37 |
1.2332 times |
Fri 17 October 2025 |
31.35 (1.49%) |
31.50 |
30.60 - 35.99 |
1.9503 times |
Fri 10 October 2025 |
30.89 (-4.48%) |
31.66 |
30.77 - 33.29 |
1.6118 times |
Fri 03 October 2025 |
32.34 (31.84%) |
25.02 |
24.63 - 32.60 |
1.9849 times |
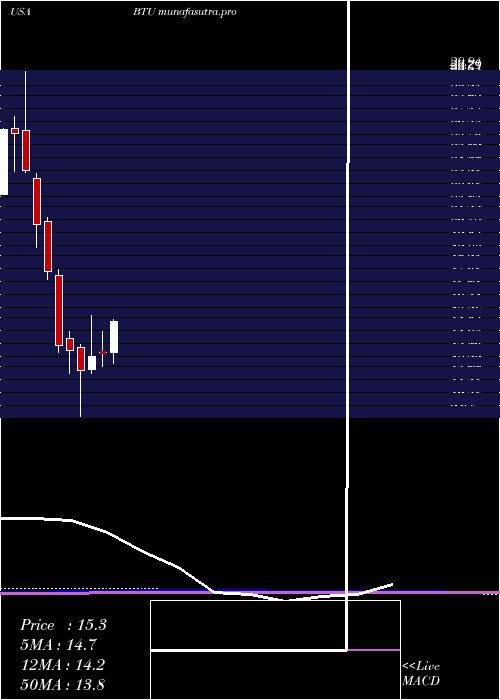
Monthly price and charts PeabodyEnergy Strong monthly Stock price targets for PeabodyEnergy BTU are 28.05 and 31.25 | Monthly Target 1 | 25.43 | | Monthly Target 2 | 27.47 | | Monthly Target 3 | 28.63 | | Monthly Target 4 | 30.67 | | Monthly Target 5 | 31.83 |
Monthly price and volumes Peabody Energy
| Date |
Closing |
Open |
Range |
Volume |
Thu 04 December 2025 |
29.51 (8.33%) |
27.09 |
26.59 - 29.79 |
0.1268 times |
Fri 28 November 2025 |
27.24 (-0.66%) |
28.78 |
25.46 - 31.16 |
0.5258 times |
Fri 31 October 2025 |
27.42 (3.39%) |
26.68 |
24.60 - 35.99 |
1.3612 times |
Tue 30 September 2025 |
26.52 (52.41%) |
17.22 |
16.46 - 26.97 |
1.2307 times |
Fri 29 August 2025 |
17.40 (7.74%) |
15.71 |
15.38 - 18.84 |
0.9623 times |
Thu 31 July 2025 |
16.15 (20.34%) |
13.39 |
12.77 - 17.78 |
1.373 times |
Mon 30 June 2025 |
13.42 (1.98%) |
13.43 |
12.58 - 14.62 |
0.9007 times |
Fri 30 May 2025 |
13.16 (6.65%) |
12.41 |
12.19 - 15.60 |
1.1164 times |
Wed 30 April 2025 |
12.34 (-8.93%) |
13.70 |
9.61 - 13.87 |
1.3714 times |
Mon 31 March 2025 |
13.55 (-1.74%) |
14.22 |
12.15 - 14.64 |
1.0316 times |
Fri 28 February 2025 |
13.79 (-24.02%) |
17.94 |
13.40 - 18.28 |
0.8212 times |
DMA SMA EMA moving averages of Peabody Energy BTU
DMA (daily moving average) of Peabody Energy BTU
| DMA period | DMA value | | 5 day DMA | 28.1 | | 12 day DMA | 27.42 | | 20 day DMA | 28.27 | | 35 day DMA | 28.54 | | 50 day DMA | 29.02 | | 100 day DMA | 23.44 | | 150 day DMA | 20.25 | | 200 day DMA | 18.44 | EMA (exponential moving average) of Peabody Energy BTU
| EMA period | EMA current | EMA prev | EMA prev2 | | 5 day EMA | 28.44 | 27.9 | 27.13 | | 12 day EMA | 27.98 | 27.7 | 27.39 | | 20 day EMA | 28.04 | 27.89 | 27.73 | | 35 day EMA | 28.24 | 28.16 | 28.09 | | 50 day EMA | 28.48 | 28.44 | 28.4 |
SMA (simple moving average) of Peabody Energy BTU
| SMA period | SMA current | SMA prev | SMA prev2 | | 5 day SMA | 28.1 | 27.6 | 27.03 | | 12 day SMA | 27.42 | 27.33 | 27.29 | | 20 day SMA | 28.27 | 28.25 | 28.25 | | 35 day SMA | 28.54 | 28.64 | 28.8 | | 50 day SMA | 29.02 | 28.94 | 28.83 | | 100 day SMA | 23.44 | 23.3 | 23.15 | | 150 day SMA | 20.25 | 20.14 | 20.03 | | 200 day SMA | 18.44 | 18.36 | 18.29 |
|
|
