BritishAmerican BTI full analysis,charts,indicators,moving averages,SMA,DMA,EMA,ADX,MACD,RSIBritish American BTI WideScreen charts, DMA,SMA,EMA technical analysis, forecast prediction, by indicators ADX,MACD,RSI,CCI USA stock exchange
operates under Consumer Non Durables sector & deals in Farming Seeds Milling
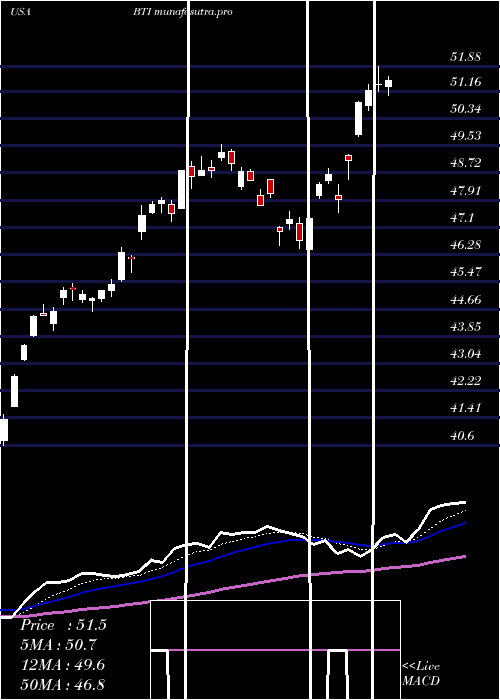
Daily price and charts and targets BritishAmerican Strong Daily Stock price targets for BritishAmerican BTI are 57.94 and 58.36 | Daily Target 1 | 57.62 | | Daily Target 2 | 57.83 | | Daily Target 3 | 58.04 | | Daily Target 4 | 58.25 | | Daily Target 5 | 58.46 |
Daily price and volume British American
| Date |
Closing |
Open |
Range |
Volume |
Thu 04 December 2025 |
58.04 (0.92%) |
57.94 |
57.83 - 58.25 |
1.8573 times |
Wed 03 December 2025 |
57.51 (-0.73%) |
58.60 |
57.48 - 58.74 |
1.0055 times |
Tue 02 December 2025 |
57.93 (-0.34%) |
58.10 |
57.69 - 58.17 |
1.0149 times |
Mon 01 December 2025 |
58.13 (-0.9%) |
58.56 |
58.09 - 58.63 |
0.9274 times |
Fri 28 November 2025 |
58.66 (1.47%) |
58.04 |
58.00 - 58.70 |
0.6574 times |
Wed 26 November 2025 |
57.81 (2.03%) |
57.00 |
56.69 - 57.87 |
0.7259 times |
Tue 25 November 2025 |
56.66 (3.45%) |
56.33 |
56.10 - 56.94 |
1.4025 times |
Mon 24 November 2025 |
54.77 (-0.87%) |
55.32 |
54.72 - 56.12 |
0.7705 times |
Fri 21 November 2025 |
55.25 (0.91%) |
55.12 |
55.11 - 55.73 |
0.8838 times |
Thu 20 November 2025 |
54.75 (0.02%) |
54.97 |
54.51 - 55.03 |
0.7549 times |
Wed 19 November 2025 |
54.74 (-0.22%) |
54.82 |
54.57 - 55.10 |
1.2006 times |
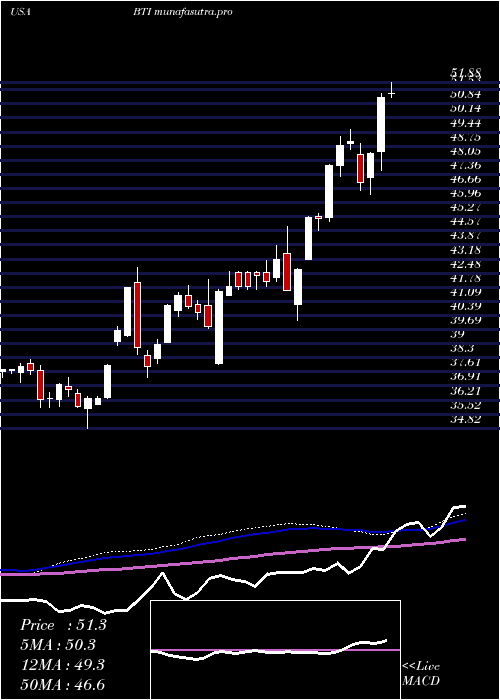
Weekly price and charts BritishAmerican Strong weekly Stock price targets for BritishAmerican BTI are 57.13 and 58.39 | Weekly Target 1 | 56.83 | | Weekly Target 2 | 57.43 | | Weekly Target 3 | 58.086666666667 | | Weekly Target 4 | 58.69 | | Weekly Target 5 | 59.35 |
Weekly price and volumes for British American
| Date |
Closing |
Open |
Range |
Volume |
Thu 04 December 2025 |
58.04 (-1.06%) |
58.56 |
57.48 - 58.74 |
1.0555 times |
Fri 28 November 2025 |
58.66 (6.17%) |
55.32 |
54.72 - 58.70 |
0.7812 times |
Fri 21 November 2025 |
55.25 (2.07%) |
54.74 |
54.30 - 55.73 |
1.1788 times |
Fri 14 November 2025 |
54.13 (-0.84%) |
54.84 |
53.33 - 56.24 |
1.038 times |
Fri 07 November 2025 |
54.59 (6.64%) |
52.65 |
52.43 - 54.73 |
1.204 times |
Fri 31 October 2025 |
51.19 (0%) |
51.15 |
51.03 - 51.52 |
0.2081 times |
Fri 31 October 2025 |
51.19 (-1.69%) |
52.69 |
50.84 - 52.77 |
1.0361 times |
Fri 24 October 2025 |
52.07 (0.87%) |
51.99 |
49.88 - 52.17 |
1.118 times |
Fri 17 October 2025 |
51.62 (0.16%) |
50.97 |
50.13 - 51.69 |
1.1251 times |
Fri 10 October 2025 |
51.54 (0.55%) |
51.21 |
50.84 - 52.10 |
1.2553 times |
Fri 03 October 2025 |
51.26 (-3.28%) |
52.85 |
51.18 - 53.21 |
1.2847 times |
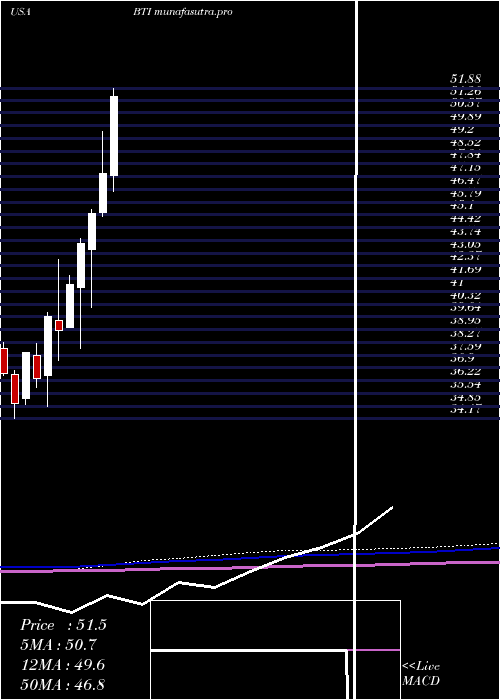
Monthly price and charts BritishAmerican Strong monthly Stock price targets for BritishAmerican BTI are 57.13 and 58.39 | Monthly Target 1 | 56.83 | | Monthly Target 2 | 57.43 | | Monthly Target 3 | 58.086666666667 | | Monthly Target 4 | 58.69 | | Monthly Target 5 | 59.35 |
Monthly price and volumes British American
| Date |
Closing |
Open |
Range |
Volume |
Thu 04 December 2025 |
58.04 (-1.06%) |
58.56 |
57.48 - 58.74 |
0.1708 times |
Fri 28 November 2025 |
58.66 (14.59%) |
52.65 |
52.43 - 58.70 |
0.6798 times |
Fri 31 October 2025 |
51.19 (-3.56%) |
53.18 |
49.88 - 53.21 |
0.872 times |
Tue 30 September 2025 |
53.08 (-6.7%) |
54.75 |
51.78 - 57.42 |
0.9449 times |
Fri 29 August 2025 |
56.89 (5.98%) |
54.54 |
54.15 - 59.29 |
0.9383 times |
Thu 31 July 2025 |
53.68 (13.42%) |
47.20 |
46.38 - 54.20 |
1.3616 times |
Mon 30 June 2025 |
47.33 (4.71%) |
45.21 |
45.04 - 49.56 |
1.3153 times |
Fri 30 May 2025 |
45.20 (3.79%) |
43.27 |
40.12 - 45.41 |
1.4803 times |
Wed 30 April 2025 |
43.55 (5.27%) |
41.23 |
37.96 - 43.86 |
1.3425 times |
Mon 31 March 2025 |
41.37 (6.27%) |
39.06 |
39.06 - 41.87 |
0.8945 times |
Fri 28 February 2025 |
38.93 (-1.79%) |
39.42 |
37.31 - 42.74 |
0.9758 times |
DMA SMA EMA moving averages of British American BTI
DMA (daily moving average) of British American BTI
| DMA period | DMA value | | 5 day DMA | 58.05 | | 12 day DMA | 56.59 | | 20 day DMA | 55.91 | | 35 day DMA | 54.13 | | 50 day DMA | 53.44 | | 100 day DMA | 54.43 | | 150 day DMA | 51.72 | | 200 day DMA | 49 | EMA (exponential moving average) of British American BTI
| EMA period | EMA current | EMA prev | EMA prev2 | | 5 day EMA | 57.72 | 57.56 | 57.58 | | 12 day EMA | 56.83 | 56.61 | 56.45 | | 20 day EMA | 56 | 55.78 | 55.6 | | 35 day EMA | 54.96 | 54.78 | 54.62 | | 50 day EMA | 53.92 | 53.75 | 53.6 |
SMA (simple moving average) of British American BTI
| SMA period | SMA current | SMA prev | SMA prev2 | | 5 day SMA | 58.05 | 58.01 | 57.84 | | 12 day SMA | 56.59 | 56.32 | 56.03 | | 20 day SMA | 55.91 | 55.7 | 55.48 | | 35 day SMA | 54.13 | 53.92 | 53.73 | | 50 day SMA | 53.44 | 53.32 | 53.24 | | 100 day SMA | 54.43 | 54.37 | 54.31 | | 150 day SMA | 51.72 | 51.63 | 51.53 | | 200 day SMA | 49 | 48.9 | 48.8 |
|
|
