BostonScientific BSX full analysis,charts,indicators,moving averages,SMA,DMA,EMA,ADX,MACD,RSIBoston Scientific BSX WideScreen charts, DMA,SMA,EMA technical analysis, forecast prediction, by indicators ADX,MACD,RSI,CCI USA stock exchange
operates under Health Care sector & deals in Medical Dental Instruments
Daily price and charts and targets BostonScientific Strong Daily Stock price targets for BostonScientific BSX are 96.38 and 98.49 | Daily Target 1 | 95.93 | | Daily Target 2 | 96.83 | | Daily Target 3 | 98.043333333333 | | Daily Target 4 | 98.94 | | Daily Target 5 | 100.15 |
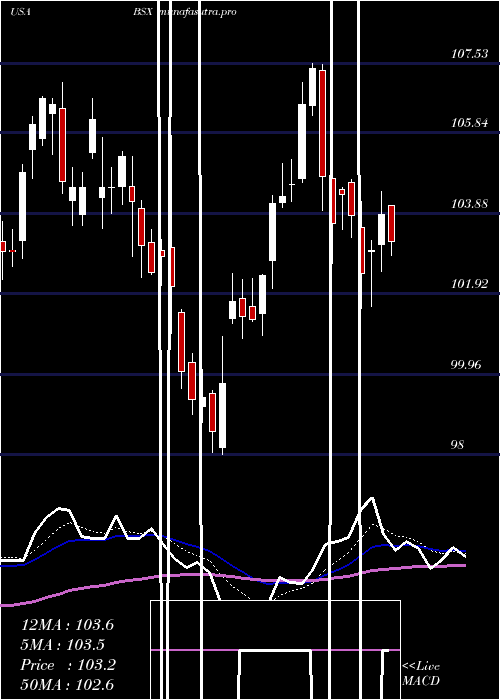
Daily price and volume Boston Scientific
| Date |
Closing |
Open |
Range |
Volume |
Thu 04 December 2025 |
97.72 (-0.86%) |
98.65 |
97.15 - 99.26 |
1.0588 times |
Wed 03 December 2025 |
98.57 (-0.45%) |
99.00 |
97.64 - 99.34 |
1.1107 times |
Tue 02 December 2025 |
99.02 (-1.97%) |
101.06 |
98.99 - 101.82 |
0.8979 times |
Mon 01 December 2025 |
101.01 (-0.56%) |
101.63 |
100.88 - 101.91 |
0.6319 times |
Fri 28 November 2025 |
101.58 (0.61%) |
101.55 |
100.50 - 101.73 |
0.3173 times |
Wed 26 November 2025 |
100.96 (-0.39%) |
100.92 |
100.90 - 101.69 |
0.5976 times |
Tue 25 November 2025 |
101.36 (3.39%) |
98.85 |
98.74 - 101.76 |
0.9935 times |
Mon 24 November 2025 |
98.04 (1.2%) |
96.29 |
96.13 - 98.29 |
1.9919 times |
Fri 21 November 2025 |
96.88 (0.29%) |
96.45 |
96.07 - 98.35 |
1.5068 times |
Thu 20 November 2025 |
96.60 (-0.42%) |
97.34 |
96.34 - 98.36 |
0.8935 times |
Wed 19 November 2025 |
97.01 (-2.23%) |
99.34 |
95.99 - 99.44 |
1.8199 times |
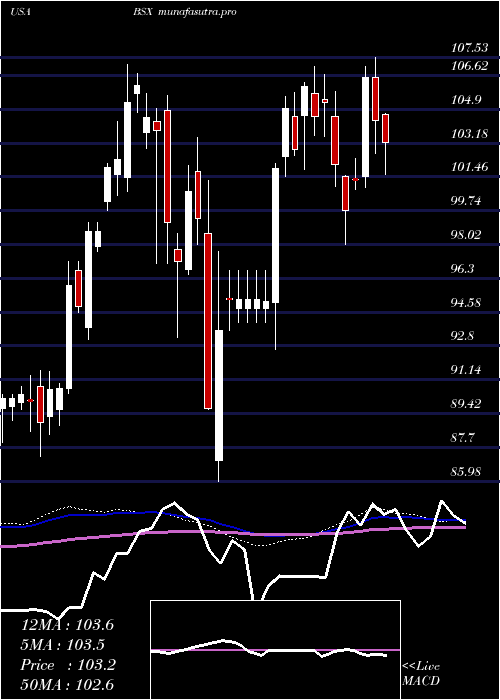
Weekly price and charts BostonScientific Strong weekly Stock price targets for BostonScientific BSX are 95.06 and 99.82 | Weekly Target 1 | 94.17 | | Weekly Target 2 | 95.94 | | Weekly Target 3 | 98.926666666667 | | Weekly Target 4 | 100.7 | | Weekly Target 5 | 103.69 |
Weekly price and volumes for Boston Scientific
| Date |
Closing |
Open |
Range |
Volume |
Thu 04 December 2025 |
97.72 (-3.8%) |
101.63 |
97.15 - 101.91 |
1.0259 times |
Fri 28 November 2025 |
101.58 (4.85%) |
96.29 |
96.13 - 101.76 |
1.0816 times |
Fri 21 November 2025 |
96.88 (-5.66%) |
102.27 |
95.99 - 102.71 |
1.6971 times |
Fri 14 November 2025 |
102.69 (2.69%) |
99.34 |
98.84 - 105.65 |
1.1957 times |
Fri 07 November 2025 |
100.00 (-0.71%) |
98.09 |
97.45 - 100.31 |
0.6524 times |
Fri 31 October 2025 |
100.72 (0%) |
100.41 |
99.94 - 101.15 |
0.227 times |
Fri 31 October 2025 |
100.72 (-0.37%) |
101.39 |
99.72 - 102.86 |
1.0471 times |
Fri 24 October 2025 |
101.09 (1.86%) |
99.81 |
99.15 - 105.49 |
1.4742 times |
Fri 17 October 2025 |
99.24 (3.48%) |
95.13 |
94.53 - 99.61 |
1.1571 times |
Tue 07 October 2025 |
95.90 (-1.47%) |
97.01 |
95.38 - 97.58 |
0.4418 times |
Fri 03 October 2025 |
97.33 (-0.87%) |
98.11 |
90.69 - 99.01 |
2.0161 times |
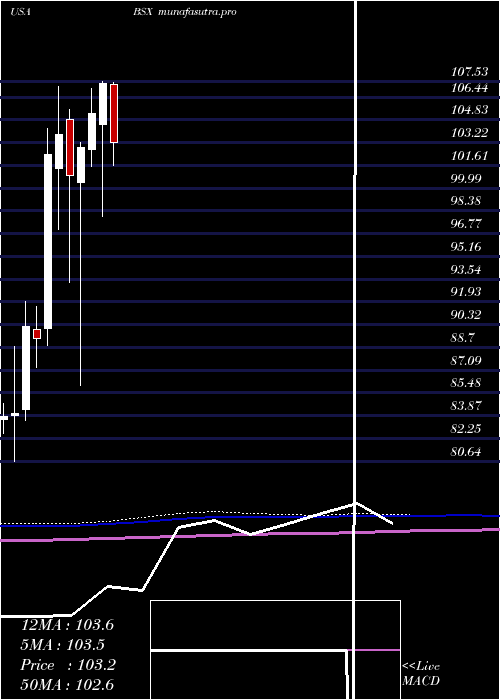
Monthly price and charts BostonScientific Strong monthly Stock price targets for BostonScientific BSX are 95.06 and 99.82 | Monthly Target 1 | 94.17 | | Monthly Target 2 | 95.94 | | Monthly Target 3 | 98.926666666667 | | Monthly Target 4 | 100.7 | | Monthly Target 5 | 103.69 |
Monthly price and volumes Boston Scientific
| Date |
Closing |
Open |
Range |
Volume |
Thu 04 December 2025 |
97.72 (-3.8%) |
101.63 |
97.15 - 101.91 |
0.217 times |
Fri 28 November 2025 |
101.58 (0.85%) |
98.09 |
95.99 - 105.65 |
0.9786 times |
Fri 31 October 2025 |
100.72 (3.17%) |
97.95 |
90.69 - 105.49 |
1.1789 times |
Tue 30 September 2025 |
97.63 (-7.46%) |
105.47 |
95.84 - 109.50 |
1.4981 times |
Fri 29 August 2025 |
105.50 (0.55%) |
104.75 |
101.60 - 107.01 |
0.811 times |
Thu 31 July 2025 |
104.92 (-2.32%) |
107.36 |
101.56 - 108.94 |
1.1023 times |
Mon 30 June 2025 |
107.41 (2.04%) |
104.53 |
98.00 - 107.53 |
0.9986 times |
Fri 30 May 2025 |
105.26 (2.32%) |
102.76 |
101.51 - 107.06 |
0.9278 times |
Wed 30 April 2025 |
102.87 (1.97%) |
100.40 |
85.98 - 103.20 |
1.2668 times |
Mon 31 March 2025 |
100.88 (-2.8%) |
104.85 |
93.29 - 105.57 |
1.021 times |
Fri 28 February 2025 |
103.79 (1.4%) |
101.41 |
97.08 - 107.17 |
0.9065 times |
DMA SMA EMA moving averages of Boston Scientific BSX
DMA (daily moving average) of Boston Scientific BSX
| DMA period | DMA value | | 5 day DMA | 99.58 | | 12 day DMA | 99 | | 20 day DMA | 100.2 | | 35 day DMA | 100.35 | | 50 day DMA | 99.34 | | 100 day DMA | 101.84 | | 150 day DMA | 102.38 | | 200 day DMA | 101.5 | EMA (exponential moving average) of Boston Scientific BSX
| EMA period | EMA current | EMA prev | EMA prev2 | | 5 day EMA | 98.95 | 99.57 | 100.07 | | 12 day EMA | 99.52 | 99.85 | 100.08 | | 20 day EMA | 99.74 | 99.95 | 100.09 | | 35 day EMA | 99.56 | 99.67 | 99.73 | | 50 day EMA | 99.3 | 99.36 | 99.39 |
SMA (simple moving average) of Boston Scientific BSX
| SMA period | SMA current | SMA prev | SMA prev2 | | 5 day SMA | 99.58 | 100.23 | 100.79 | | 12 day SMA | 99 | 99.33 | 99.68 | | 20 day SMA | 100.2 | 100.26 | 100.27 | | 35 day SMA | 100.35 | 100.35 | 100.28 | | 50 day SMA | 99.34 | 99.34 | 99.33 | | 100 day SMA | 101.84 | 101.9 | 101.94 | | 150 day SMA | 102.38 | 102.41 | 102.43 | | 200 day SMA | 101.5 | 101.54 | 101.58 |
|
|
