BlackStone BSM full analysis,charts,indicators,moving averages,SMA,DMA,EMA,ADX,MACD,RSIBlack Stone BSM WideScreen charts, DMA,SMA,EMA technical analysis, forecast prediction, by indicators ADX,MACD,RSI,CCI USA stock exchange
operates under Energy sector & deals in Oil Gas Production
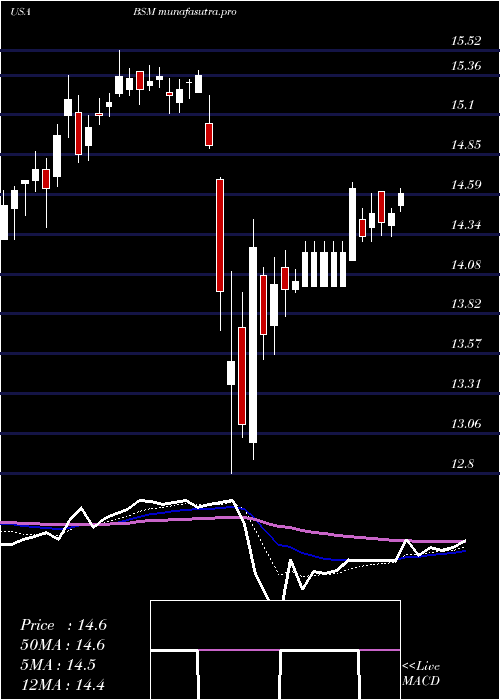
Daily price and charts and targets BlackStone Strong Daily Stock price targets for BlackStone BSM are 12.54 and 12.72 | Daily Target 1 | 12.39 | | Daily Target 2 | 12.51 | | Daily Target 3 | 12.573333333333 | | Daily Target 4 | 12.69 | | Daily Target 5 | 12.75 |
Daily price and volume Black Stone
| Date |
Closing |
Open |
Range |
Volume |
Mon 20 October 2025 |
12.62 (0.48%) |
12.56 |
12.46 - 12.64 |
0.9709 times |
Fri 17 October 2025 |
12.56 (1.95%) |
12.42 |
12.36 - 12.57 |
1.0194 times |
Thu 16 October 2025 |
12.32 (-1.44%) |
12.75 |
12.32 - 12.75 |
0.7577 times |
Wed 15 October 2025 |
12.50 (0.64%) |
12.44 |
12.42 - 12.60 |
0.5954 times |
Tue 14 October 2025 |
12.42 (-1.82%) |
12.39 |
12.32 - 12.51 |
1.782 times |
Mon 13 October 2025 |
12.65 (-0.32%) |
12.75 |
12.55 - 12.80 |
0.7827 times |
Fri 10 October 2025 |
12.69 (-3.57%) |
13.10 |
12.65 - 13.10 |
1.4151 times |
Thu 09 October 2025 |
13.16 (-1.57%) |
13.42 |
13.15 - 13.47 |
1.2746 times |
Wed 08 October 2025 |
13.37 (-1.04%) |
13.50 |
13.33 - 13.50 |
0.8434 times |
Tue 07 October 2025 |
13.51 (-0.07%) |
13.46 |
13.35 - 13.51 |
0.5587 times |
Mon 06 October 2025 |
13.52 (1.35%) |
13.37 |
13.34 - 13.54 |
1.0194 times |
Weekly price and charts BlackStone Strong weekly Stock price targets for BlackStone BSM are 12.54 and 12.72 | Weekly Target 1 | 12.39 | | Weekly Target 2 | 12.51 | | Weekly Target 3 | 12.573333333333 | | Weekly Target 4 | 12.69 | | Weekly Target 5 | 12.75 |
Weekly price and volumes for Black Stone
| Date |
Closing |
Open |
Range |
Volume |
Mon 20 October 2025 |
12.62 (0.48%) |
12.56 |
12.46 - 12.64 |
0.1997 times |
Fri 17 October 2025 |
12.56 (-1.02%) |
12.75 |
12.32 - 12.80 |
1.0153 times |
Fri 10 October 2025 |
12.69 (-4.87%) |
13.37 |
12.65 - 13.54 |
1.0511 times |
Fri 03 October 2025 |
13.34 (-0.22%) |
13.34 |
12.96 - 13.37 |
0.7227 times |
Fri 26 September 2025 |
13.37 (3.24%) |
12.92 |
12.83 - 13.50 |
1.1506 times |
Fri 19 September 2025 |
12.95 (3.35%) |
12.54 |
12.48 - 13.00 |
1.2847 times |
Fri 12 September 2025 |
12.53 (4.85%) |
11.95 |
11.78 - 12.63 |
1.2312 times |
Fri 05 September 2025 |
11.95 (-1.73%) |
12.06 |
11.93 - 12.24 |
0.879 times |
Fri 29 August 2025 |
12.16 (0%) |
12.14 |
12.12 - 12.26 |
0.6941 times |
Fri 29 August 2025 |
12.16 (-1.54%) |
12.32 |
11.97 - 12.43 |
1.7716 times |
Fri 22 August 2025 |
12.35 (0.57%) |
12.28 |
11.90 - 12.37 |
0.8923 times |
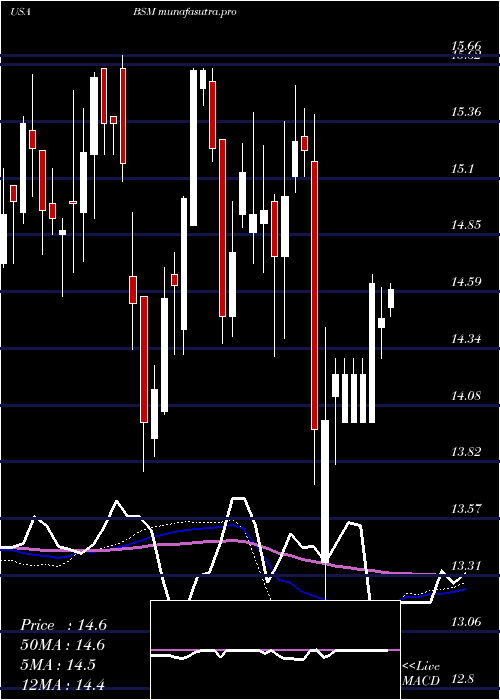
Monthly price and charts BlackStone Strong monthly Stock price targets for BlackStone BSM are 11.86 and 13.08 | Monthly Target 1 | 11.61 | | Monthly Target 2 | 12.11 | | Monthly Target 3 | 12.826666666667 | | Monthly Target 4 | 13.33 | | Monthly Target 5 | 14.05 |
Monthly price and volumes Black Stone
| Date |
Closing |
Open |
Range |
Volume |
Mon 20 October 2025 |
12.62 (-3.96%) |
13.02 |
12.32 - 13.54 |
0.608 times |
Tue 30 September 2025 |
13.14 (8.06%) |
12.06 |
11.78 - 13.50 |
1.1529 times |
Fri 29 August 2025 |
12.16 (-2.95%) |
12.60 |
11.90 - 12.95 |
1.3722 times |
Thu 31 July 2025 |
12.53 (-4.2%) |
13.01 |
11.98 - 13.57 |
1.3853 times |
Mon 30 June 2025 |
13.08 (-2.02%) |
13.39 |
12.78 - 14.05 |
0.8973 times |
Fri 30 May 2025 |
13.35 (-5.39%) |
14.07 |
13.32 - 14.58 |
0.8259 times |
Wed 30 April 2025 |
14.11 (-7.6%) |
15.31 |
12.80 - 15.39 |
0.939 times |
Mon 31 March 2025 |
15.27 (2.07%) |
15.00 |
14.30 - 15.52 |
0.7958 times |
Fri 28 February 2025 |
14.96 (3.31%) |
14.48 |
14.39 - 15.40 |
1.1462 times |
Fri 31 January 2025 |
14.48 (-0.82%) |
14.60 |
14.31 - 15.60 |
0.8774 times |
Tue 31 December 2024 |
14.60 (-4.89%) |
15.60 |
13.78 - 15.66 |
1.2279 times |

DMA SMA EMA moving averages of Black Stone BSM
DMA (daily moving average) of Black Stone BSM
| DMA period | DMA value | | 5 day DMA | 12.48 | | 12 day DMA | 12.89 | | 20 day DMA | 13.04 | | 35 day DMA | 12.8 | | 50 day DMA | 12.62 | | 100 day DMA | 12.81 | | 150 day DMA | 13.3 | | 200 day DMA | 13.72 | EMA (exponential moving average) of Black Stone BSM
| EMA period | EMA current | EMA prev | EMA prev2 | | 5 day EMA | 12.58 | 12.56 | 12.56 | | 12 day EMA | 12.76 | 12.78 | 12.82 | | 20 day EMA | 12.82 | 12.84 | 12.87 | | 35 day EMA | 12.75 | 12.76 | 12.77 | | 50 day EMA | 12.59 | 12.59 | 12.59 |
SMA (simple moving average) of Black Stone BSM
| SMA period | SMA current | SMA prev | SMA prev2 | | 5 day SMA | 12.48 | 12.49 | 12.52 | | 12 day SMA | 12.89 | 12.94 | 13 | | 20 day SMA | 13.04 | 13.05 | 13.07 | | 35 day SMA | 12.8 | 12.78 | 12.77 | | 50 day SMA | 12.62 | 12.61 | 12.6 | | 100 day SMA | 12.81 | 12.82 | 12.83 | | 150 day SMA | 13.3 | 13.31 | 13.33 | | 200 day SMA | 13.72 | 13.73 | 13.74 |
|
|
