BlackstoneGso BSL full analysis,charts,indicators,moving averages,SMA,DMA,EMA,ADX,MACD,RSIBlackstone Gso BSL WideScreen charts, DMA,SMA,EMA technical analysis, forecast prediction, by indicators ADX,MACD,RSI,CCI USA stock exchange
operates under N A sector & deals in N A
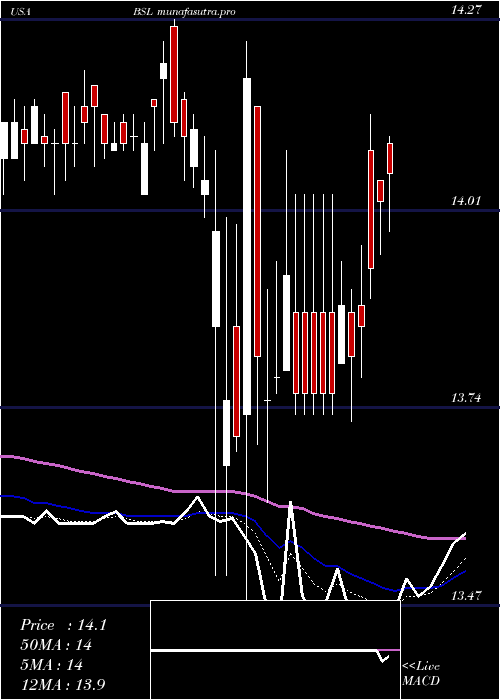
Daily price and charts and targets BlackstoneGso Strong Daily Stock price targets for BlackstoneGso BSL are 13.65 and 13.73 | Daily Target 1 | 13.58 | | Daily Target 2 | 13.63 | | Daily Target 3 | 13.66 | | Daily Target 4 | 13.71 | | Daily Target 5 | 13.74 |
Daily price and volume Blackstone Gso
| Date |
Closing |
Open |
Range |
Volume |
Fri 05 December 2025 |
13.68 (0%) |
13.66 |
13.61 - 13.69 |
0.7471 times |
Thu 04 December 2025 |
13.68 (0.07%) |
13.66 |
13.66 - 13.69 |
0.9611 times |
Wed 03 December 2025 |
13.67 (0.07%) |
13.69 |
13.66 - 13.69 |
0.6124 times |
Tue 02 December 2025 |
13.66 (-0.15%) |
13.66 |
13.65 - 13.71 |
0.7452 times |
Mon 01 December 2025 |
13.68 (0.07%) |
13.69 |
13.60 - 13.71 |
1.2322 times |
Fri 28 November 2025 |
13.67 (0.29%) |
13.70 |
13.62 - 13.74 |
0.7047 times |
Wed 26 November 2025 |
13.63 (0.07%) |
13.58 |
13.57 - 13.64 |
1.1474 times |
Tue 25 November 2025 |
13.62 (0.52%) |
13.57 |
13.56 - 13.64 |
1.057 times |
Mon 24 November 2025 |
13.55 (0.37%) |
13.49 |
13.46 - 13.63 |
1.6805 times |
Fri 21 November 2025 |
13.50 (-0.52%) |
13.61 |
13.45 - 13.61 |
1.1123 times |
Thu 20 November 2025 |
13.57 (-2.02%) |
13.78 |
13.52 - 13.78 |
1.9775 times |
Weekly price and charts BlackstoneGso Strong weekly Stock price targets for BlackstoneGso BSL are 13.59 and 13.7 | Weekly Target 1 | 13.55 | | Weekly Target 2 | 13.62 | | Weekly Target 3 | 13.663333333333 | | Weekly Target 4 | 13.73 | | Weekly Target 5 | 13.77 |
Weekly price and volumes for Blackstone Gso
| Date |
Closing |
Open |
Range |
Volume |
Fri 05 December 2025 |
13.68 (0.07%) |
13.69 |
13.60 - 13.71 |
1.131 times |
Fri 28 November 2025 |
13.67 (1.26%) |
13.49 |
13.46 - 13.74 |
1.2077 times |
Fri 21 November 2025 |
13.50 (-3.5%) |
13.94 |
13.45 - 13.94 |
1.2402 times |
Fri 14 November 2025 |
13.99 (0.94%) |
13.82 |
13.81 - 13.99 |
0.7213 times |
Fri 07 November 2025 |
13.86 (-0.07%) |
13.80 |
13.77 - 13.94 |
0.4679 times |
Fri 31 October 2025 |
13.87 (0%) |
13.97 |
13.82 - 13.97 |
0.1379 times |
Fri 31 October 2025 |
13.87 (0.14%) |
13.81 |
13.75 - 13.97 |
1.3674 times |
Fri 24 October 2025 |
13.85 (0%) |
13.78 |
13.75 - 13.91 |
0.816 times |
Fri 17 October 2025 |
13.85 (-0.07%) |
13.91 |
13.71 - 14.00 |
1.7159 times |
Fri 10 October 2025 |
13.86 (-1.07%) |
13.93 |
13.75 - 13.96 |
1.1948 times |
Fri 03 October 2025 |
14.01 (-0.07%) |
13.96 |
13.91 - 14.11 |
1.2407 times |
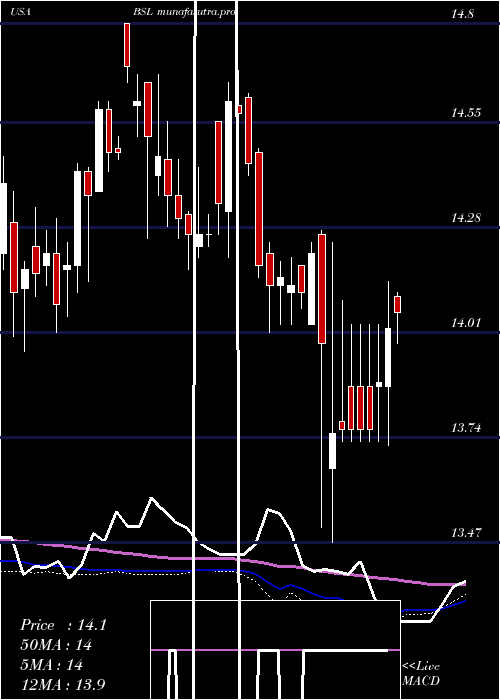
Monthly price and charts BlackstoneGso Strong monthly Stock price targets for BlackstoneGso BSL are 13.59 and 13.7 | Monthly Target 1 | 13.55 | | Monthly Target 2 | 13.62 | | Monthly Target 3 | 13.663333333333 | | Monthly Target 4 | 13.73 | | Monthly Target 5 | 13.77 |
Monthly price and volumes Blackstone Gso
| Date |
Closing |
Open |
Range |
Volume |
Fri 05 December 2025 |
13.68 (0.07%) |
13.69 |
13.60 - 13.71 |
0.2929 times |
Fri 28 November 2025 |
13.67 (-1.44%) |
13.80 |
13.45 - 13.99 |
0.9418 times |
Fri 31 October 2025 |
13.87 (-1.35%) |
13.99 |
13.71 - 14.05 |
1.516 times |
Tue 30 September 2025 |
14.06 (-1.47%) |
14.27 |
13.92 - 14.32 |
1.1505 times |
Fri 29 August 2025 |
14.27 (0.92%) |
14.16 |
14.08 - 14.35 |
0.9057 times |
Thu 31 July 2025 |
14.14 (-1.12%) |
14.28 |
14.05 - 14.35 |
1.0481 times |
Mon 30 June 2025 |
14.30 (1.49%) |
14.10 |
14.04 - 14.30 |
0.6069 times |
Fri 30 May 2025 |
14.09 (-0.07%) |
14.10 |
14.01 - 14.30 |
0.8559 times |
Wed 30 April 2025 |
14.10 (-0.21%) |
14.16 |
13.47 - 14.24 |
1.45 times |
Mon 31 March 2025 |
14.13 (0%) |
14.13 |
14.03 - 14.27 |
1.2323 times |
Fri 28 February 2025 |
14.13 (-3.22%) |
14.59 |
14.01 - 14.68 |
1.5715 times |

DMA SMA EMA moving averages of Blackstone Gso BSL
DMA (daily moving average) of Blackstone Gso BSL
| DMA period | DMA value | | 5 day DMA | 13.67 | | 12 day DMA | 13.65 | | 20 day DMA | 13.74 | | 35 day DMA | 13.79 | | 50 day DMA | 13.83 | | 100 day DMA | 14.01 | | 150 day DMA | 14.07 | | 200 day DMA | 14.06 | EMA (exponential moving average) of Blackstone Gso BSL
| EMA period | EMA current | EMA prev | EMA prev2 | | 5 day EMA | 13.67 | 13.67 | 13.66 | | 12 day EMA | 13.69 | 13.69 | 13.69 | | 20 day EMA | 13.73 | 13.73 | 13.73 | | 35 day EMA | 13.78 | 13.79 | 13.8 | | 50 day EMA | 13.82 | 13.83 | 13.84 |
SMA (simple moving average) of Blackstone Gso BSL
| SMA period | SMA current | SMA prev | SMA prev2 | | 5 day SMA | 13.67 | 13.67 | 13.66 | | 12 day SMA | 13.65 | 13.66 | 13.68 | | 20 day SMA | 13.74 | 13.75 | 13.75 | | 35 day SMA | 13.79 | 13.79 | 13.8 | | 50 day SMA | 13.83 | 13.84 | 13.84 | | 100 day SMA | 14.01 | 14.02 | 14.02 | | 150 day SMA | 14.07 | 14.07 | 14.07 | | 200 day SMA | 14.06 | 14.06 | 14.06 |
|
|
