BiosigTechnologies BSGM full analysis,charts,indicators,moving averages,SMA,DMA,EMA,ADX,MACD,RSIBiosig Technologies BSGM WideScreen charts, DMA,SMA,EMA technical analysis, forecast prediction, by indicators ADX,MACD,RSI,CCI USA stock exchange
operates under Health Care sector & deals in Biotechnology Electromedical Electrotherapeutic Apparatus
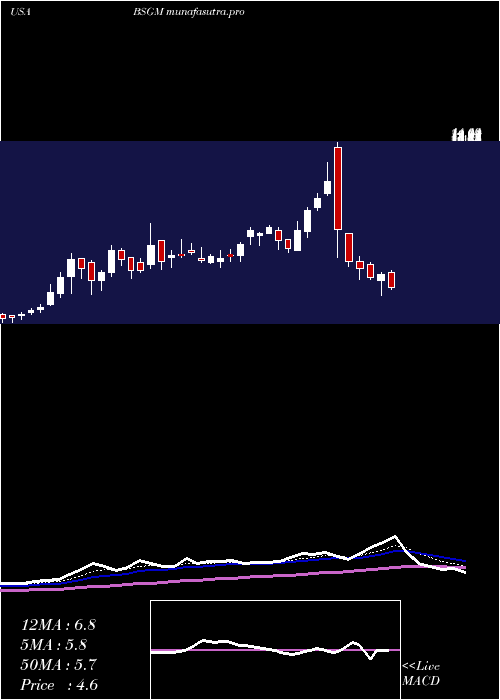
Daily price and charts and targets BiosigTechnologies Strong Daily Stock price targets for BiosigTechnologies BSGM are 3.87 and 4.47 | Daily Target 1 | 3.73 | | Daily Target 2 | 4.01 | | Daily Target 3 | 4.33 | | Daily Target 4 | 4.61 | | Daily Target 5 | 4.93 |
Daily price and volume Biosig Technologies
| Date |
Closing |
Open |
Range |
Volume |
Fri 01 August 2025 |
4.29 (-7.14%) |
4.52 |
4.05 - 4.65 |
0.6519 times |
Thu 31 July 2025 |
4.62 (2.21%) |
4.45 |
4.45 - 4.83 |
0.4505 times |
Wed 30 July 2025 |
4.52 (1.8%) |
4.51 |
4.35 - 5.02 |
0.6778 times |
Tue 29 July 2025 |
4.44 (-2.84%) |
4.65 |
4.44 - 4.97 |
0.6177 times |
Mon 28 July 2025 |
4.57 (-4.59%) |
4.79 |
4.28 - 4.87 |
0.7504 times |
Fri 25 July 2025 |
4.79 (-4.77%) |
5.39 |
4.50 - 5.39 |
1.3525 times |
Thu 24 July 2025 |
5.03 (-9.21%) |
5.64 |
4.96 - 5.68 |
0.9517 times |
Wed 23 July 2025 |
5.54 (-9.18%) |
6.25 |
5.50 - 6.45 |
1.0851 times |
Tue 22 July 2025 |
6.10 (5.9%) |
5.66 |
5.49 - 6.20 |
1.2001 times |
Mon 21 July 2025 |
5.76 (24.41%) |
4.75 |
4.65 - 5.85 |
2.2623 times |
Fri 18 July 2025 |
4.63 (-2.53%) |
4.90 |
4.52 - 5.16 |
1.2173 times |
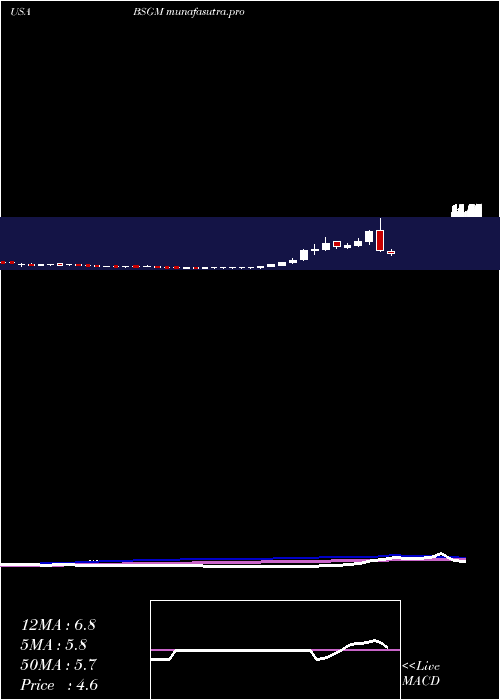
Weekly price and charts BiosigTechnologies Strong weekly Stock price targets for BiosigTechnologies BSGM are 3.69 and 4.66 | Weekly Target 1 | 3.48 | | Weekly Target 2 | 3.89 | | Weekly Target 3 | 4.4533333333333 | | Weekly Target 4 | 4.86 | | Weekly Target 5 | 5.42 |
Weekly price and volumes for Biosig Technologies
| Date |
Closing |
Open |
Range |
Volume |
Fri 01 August 2025 |
4.29 (-10.44%) |
4.79 |
4.05 - 5.02 |
0.5113 times |
Fri 25 July 2025 |
4.79 (3.46%) |
4.75 |
4.50 - 6.45 |
1.1128 times |
Fri 18 July 2025 |
4.63 (-11.47%) |
5.05 |
4.07 - 5.68 |
1.3395 times |
Fri 11 July 2025 |
5.23 (-49.76%) |
10.75 |
5.10 - 14.11 |
2.4486 times |
Thu 03 July 2025 |
10.41 (35.9%) |
7.71 |
6.90 - 10.73 |
0.4936 times |
Fri 27 June 2025 |
7.66 (14.33%) |
6.71 |
6.31 - 8.64 |
0.7104 times |
Fri 20 June 2025 |
6.70 (4.85%) |
6.25 |
5.93 - 7.11 |
0.4051 times |
Fri 13 June 2025 |
6.39 (-12.82%) |
7.66 |
5.76 - 7.74 |
0.9331 times |
Fri 06 June 2025 |
7.33 (30.89%) |
5.56 |
5.20 - 8.80 |
1.0702 times |
Fri 30 May 2025 |
5.60 (6.06%) |
5.31 |
4.11 - 6.84 |
0.9753 times |
Fri 23 May 2025 |
5.28 (102.3%) |
2.79 |
2.52 - 5.59 |
0.8068 times |
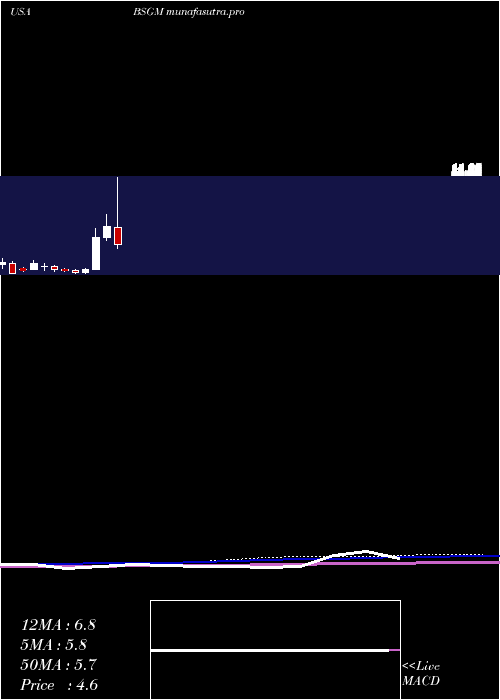
Monthly price and charts BiosigTechnologies Strong monthly Stock price targets for BiosigTechnologies BSGM are 3.87 and 4.47 | Monthly Target 1 | 3.73 | | Monthly Target 2 | 4.01 | | Monthly Target 3 | 4.33 | | Monthly Target 4 | 4.61 | | Monthly Target 5 | 4.93 |
Monthly price and volumes Biosig Technologies
| Date |
Closing |
Open |
Range |
Volume |
Fri 01 August 2025 |
4.29 (-7.14%) |
4.52 |
4.05 - 4.65 |
0.0582 times |
Thu 31 July 2025 |
4.62 (-35.29%) |
7.05 |
4.07 - 14.11 |
3.1478 times |
Mon 30 June 2025 |
7.14 (27.5%) |
5.56 |
5.20 - 8.80 |
1.7564 times |
Fri 30 May 2025 |
5.60 (443.69%) |
1.04 |
1.03 - 6.84 |
2.0482 times |
Wed 30 April 2025 |
1.03 (71.67%) |
0.60 |
0.40 - 1.14 |
0.4173 times |
Mon 31 March 2025 |
0.60 (-35.48%) |
0.95 |
0.46 - 1.03 |
0.3818 times |
Fri 28 February 2025 |
0.93 (-9.71%) |
1.03 |
0.77 - 1.24 |
0.8473 times |
Fri 31 January 2025 |
1.03 (-30.87%) |
1.51 |
0.82 - 1.67 |
0.29 times |
Tue 31 December 2024 |
1.49 (-21.99%) |
1.43 |
0.92 - 1.87 |
0.3953 times |
Tue 26 November 2024 |
1.91 (80.19%) |
1.07 |
1.04 - 2.33 |
0.6576 times |
Thu 31 October 2024 |
1.06 (125.53%) |
1.10 |
0.69 - 1.26 |
0.6018 times |
DMA SMA EMA moving averages of Biosig Technologies BSGM
DMA (daily moving average) of Biosig Technologies BSGM
| DMA period | DMA value | | 5 day DMA | 4.49 | | 12 day DMA | 4.92 | | 20 day DMA | 5.58 | | 35 day DMA | 6.49 | | 50 day DMA | 6.22 | | 100 day DMA | 3.61 | | 150 day DMA | 2.77 | | 200 day DMA | 2.48 | EMA (exponential moving average) of Biosig Technologies BSGM
| EMA period | EMA current | EMA prev | EMA prev2 | | 5 day EMA | 4.55 | 4.68 | 4.71 | | 12 day EMA | 4.98 | 5.11 | 5.2 | | 20 day EMA | 5.4 | 5.52 | 5.61 | | 35 day EMA | 5.53 | 5.6 | 5.66 | | 50 day EMA | 5.76 | 5.82 | 5.87 |
SMA (simple moving average) of Biosig Technologies BSGM
| SMA period | SMA current | SMA prev | SMA prev2 | | 5 day SMA | 4.49 | 4.59 | 4.67 | | 12 day SMA | 4.92 | 5 | 5 | | 20 day SMA | 5.58 | 5.89 | 6.14 | | 35 day SMA | 6.49 | 6.56 | 6.6 | | 50 day SMA | 6.22 | 6.19 | 6.15 | | 100 day SMA | 3.61 | 3.58 | 3.54 | | 150 day SMA | 2.77 | 2.75 | 2.73 | | 200 day SMA | 2.48 | 2.47 | 2.45 |
|
|
