BerryPetroleum BRY full analysis,charts,indicators,moving averages,SMA,DMA,EMA,ADX,MACD,RSIBerry Petroleum BRY WideScreen charts, DMA,SMA,EMA technical analysis, forecast prediction, by indicators ADX,MACD,RSI,CCI USA stock exchange
operates under Energy sector & deals in Oil Gas Production
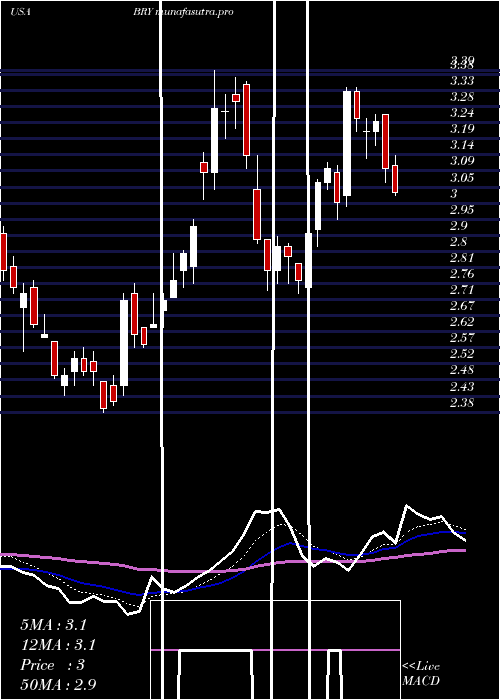
Daily price and charts and targets BerryPetroleum Strong Daily Stock price targets for BerryPetroleum BRY are 3.43 and 3.49 | Daily Target 1 | 3.38 | | Daily Target 2 | 3.41 | | Daily Target 3 | 3.44 | | Daily Target 4 | 3.47 | | Daily Target 5 | 3.5 |
Daily price and volume Berry Petroleum
| Date |
Closing |
Open |
Range |
Volume |
Thu 04 December 2025 |
3.44 (0%) |
3.43 |
3.41 - 3.47 |
0.5568 times |
Wed 03 December 2025 |
3.44 (2.08%) |
3.38 |
3.38 - 3.46 |
0.8446 times |
Tue 02 December 2025 |
3.37 (-0.3%) |
3.39 |
3.32 - 3.39 |
0.7029 times |
Mon 01 December 2025 |
3.38 (-0.29%) |
3.38 |
3.37 - 3.43 |
0.9063 times |
Fri 28 November 2025 |
3.39 (2.11%) |
3.33 |
3.33 - 3.39 |
0.4697 times |
Wed 26 November 2025 |
3.32 (1.22%) |
3.26 |
3.26 - 3.37 |
1.0598 times |
Tue 25 November 2025 |
3.28 (-1.2%) |
3.23 |
3.23 - 3.31 |
1.3857 times |
Mon 24 November 2025 |
3.32 (0.91%) |
3.29 |
3.23 - 3.34 |
1.6365 times |
Fri 21 November 2025 |
3.29 (0.3%) |
3.25 |
3.23 - 3.33 |
1.0843 times |
Thu 20 November 2025 |
3.28 (-2.38%) |
3.31 |
3.27 - 3.48 |
1.3535 times |
Wed 19 November 2025 |
3.36 (-1.18%) |
3.35 |
3.29 - 3.37 |
0.9436 times |
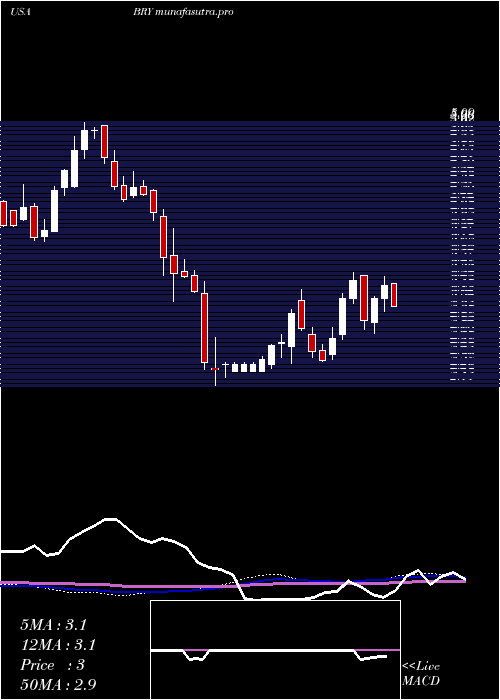
Weekly price and charts BerryPetroleum Strong weekly Stock price targets for BerryPetroleum BRY are 3.38 and 3.53 | Weekly Target 1 | 3.26 | | Weekly Target 2 | 3.35 | | Weekly Target 3 | 3.41 | | Weekly Target 4 | 3.5 | | Weekly Target 5 | 3.56 |
Weekly price and volumes for Berry Petroleum
| Date |
Closing |
Open |
Range |
Volume |
Thu 04 December 2025 |
3.44 (1.47%) |
3.38 |
3.32 - 3.47 |
0.5334 times |
Fri 28 November 2025 |
3.39 (3.04%) |
3.29 |
3.23 - 3.39 |
0.8065 times |
Fri 21 November 2025 |
3.29 (-5.19%) |
3.47 |
3.23 - 3.48 |
1.0787 times |
Fri 14 November 2025 |
3.47 (5.79%) |
3.33 |
3.27 - 3.55 |
1.4413 times |
Fri 07 November 2025 |
3.28 (-2.67%) |
3.30 |
3.24 - 3.50 |
1.1331 times |
Fri 31 October 2025 |
3.37 (0%) |
3.33 |
3.32 - 3.42 |
0.1611 times |
Fri 31 October 2025 |
3.37 (-0.59%) |
3.39 |
3.28 - 3.45 |
0.8281 times |
Fri 24 October 2025 |
3.39 (0.59%) |
3.38 |
3.26 - 3.53 |
0.8717 times |
Fri 17 October 2025 |
3.37 (-3.16%) |
3.49 |
3.32 - 3.57 |
1.5196 times |
Fri 10 October 2025 |
3.48 (-8.9%) |
3.87 |
3.47 - 3.89 |
1.6265 times |
Fri 03 October 2025 |
3.82 (-4.74%) |
4.00 |
3.68 - 4.00 |
2.0477 times |
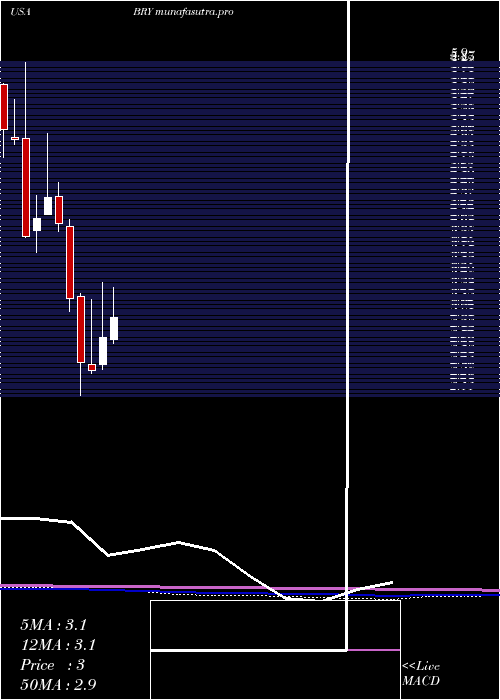
Monthly price and charts BerryPetroleum Strong monthly Stock price targets for BerryPetroleum BRY are 3.38 and 3.53 | Monthly Target 1 | 3.26 | | Monthly Target 2 | 3.35 | | Monthly Target 3 | 3.41 | | Monthly Target 4 | 3.5 | | Monthly Target 5 | 3.56 |
Monthly price and volumes Berry Petroleum
| Date |
Closing |
Open |
Range |
Volume |
Thu 04 December 2025 |
3.44 (1.47%) |
3.38 |
3.32 - 3.47 |
0.076 times |
Fri 28 November 2025 |
3.39 (0.59%) |
3.30 |
3.23 - 3.55 |
0.6356 times |
Fri 31 October 2025 |
3.37 (-10.85%) |
3.75 |
3.26 - 3.89 |
0.8764 times |
Tue 30 September 2025 |
3.78 (13.17%) |
3.33 |
3.11 - 4.15 |
2.5073 times |
Fri 29 August 2025 |
3.34 (10.6%) |
3.01 |
2.71 - 3.38 |
0.8114 times |
Thu 31 July 2025 |
3.02 (9.03%) |
2.75 |
2.70 - 3.35 |
0.9031 times |
Mon 30 June 2025 |
2.77 (15.9%) |
2.46 |
2.40 - 3.39 |
1.192 times |
Fri 30 May 2025 |
2.39 (-3.63%) |
2.46 |
2.36 - 3.20 |
0.9746 times |
Wed 30 April 2025 |
2.48 (-22.74%) |
3.23 |
2.11 - 3.27 |
1.0788 times |
Mon 31 March 2025 |
3.21 (-21.13%) |
4.03 |
3.06 - 4.11 |
0.9448 times |
Fri 28 February 2025 |
4.07 (-6.65%) |
4.38 |
3.98 - 4.54 |
0.5943 times |
DMA SMA EMA moving averages of Berry Petroleum BRY
DMA (daily moving average) of Berry Petroleum BRY
| DMA period | DMA value | | 5 day DMA | 3.4 | | 12 day DMA | 3.36 | | 20 day DMA | 3.37 | | 35 day DMA | 3.37 | | 50 day DMA | 3.47 | | 100 day DMA | 3.35 | | 150 day DMA | 3.17 | | 200 day DMA | 3.15 | EMA (exponential moving average) of Berry Petroleum BRY
| EMA period | EMA current | EMA prev | EMA prev2 | | 5 day EMA | 3.41 | 3.39 | 3.36 | | 12 day EMA | 3.37 | 3.36 | 3.35 | | 20 day EMA | 3.39 | 3.38 | 3.37 | | 35 day EMA | 3.45 | 3.45 | 3.45 | | 50 day EMA | 3.5 | 3.5 | 3.5 |
SMA (simple moving average) of Berry Petroleum BRY
| SMA period | SMA current | SMA prev | SMA prev2 | | 5 day SMA | 3.4 | 3.38 | 3.35 | | 12 day SMA | 3.36 | 3.35 | 3.36 | | 20 day SMA | 3.37 | 3.36 | 3.36 | | 35 day SMA | 3.37 | 3.37 | 3.37 | | 50 day SMA | 3.47 | 3.48 | 3.49 | | 100 day SMA | 3.35 | 3.34 | 3.34 | | 150 day SMA | 3.17 | 3.17 | 3.16 | | 200 day SMA | 3.15 | 3.16 | 3.16 |
|
|
