BrixmorProperty BRX full analysis,charts,indicators,moving averages,SMA,DMA,EMA,ADX,MACD,RSIBrixmor Property BRX WideScreen charts, DMA,SMA,EMA technical analysis, forecast prediction, by indicators ADX,MACD,RSI,CCI USA stock exchange
operates under Consumer Services sector & deals in Real Estate Investment Trusts
Daily price and charts and targets BrixmorProperty Strong Daily Stock price targets for BrixmorProperty BRX are 25.11 and 25.38 | Daily Target 1 | 25.06 | | Daily Target 2 | 25.16 | | Daily Target 3 | 25.33 | | Daily Target 4 | 25.43 | | Daily Target 5 | 25.6 |
Daily price and volume Brixmor Property
| Date |
Closing |
Open |
Range |
Volume |
Thu 04 December 2025 |
25.26 (-0.43%) |
25.37 |
25.23 - 25.50 |
0.7435 times |
Wed 03 December 2025 |
25.37 (-0.63%) |
25.61 |
25.19 - 25.76 |
1.2497 times |
Tue 02 December 2025 |
25.53 (-1.39%) |
25.89 |
25.44 - 25.93 |
1.6024 times |
Mon 01 December 2025 |
25.89 (-0.96%) |
25.99 |
25.84 - 26.14 |
0.8436 times |
Fri 28 November 2025 |
26.14 (0.04%) |
26.11 |
26.04 - 26.21 |
0.3727 times |
Wed 26 November 2025 |
26.13 (0.15%) |
26.06 |
25.96 - 26.24 |
1.1407 times |
Tue 25 November 2025 |
26.09 (0.19%) |
26.03 |
26.03 - 26.37 |
1.1635 times |
Mon 24 November 2025 |
26.04 (-1.33%) |
26.21 |
25.93 - 26.43 |
1.1783 times |
Fri 21 November 2025 |
26.39 (1.58%) |
26.07 |
26.02 - 26.61 |
0.77 times |
Thu 20 November 2025 |
25.98 (0.35%) |
26.07 |
25.96 - 26.43 |
0.9356 times |
Wed 19 November 2025 |
25.89 (-0.92%) |
26.18 |
25.74 - 26.21 |
0.7689 times |
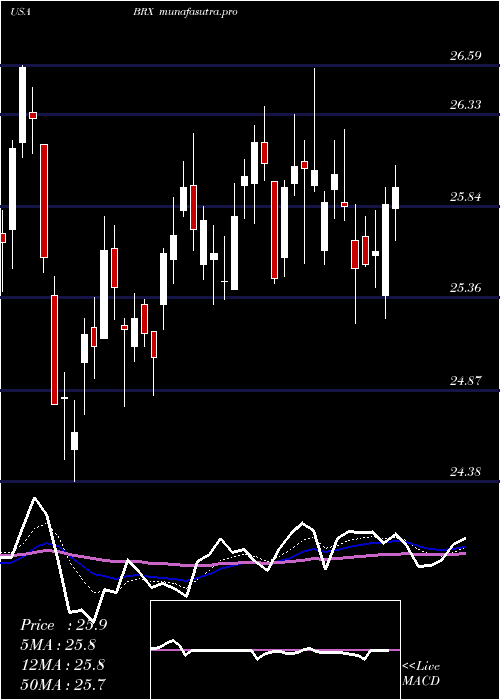
Weekly price and charts BrixmorProperty Strong weekly Stock price targets for BrixmorProperty BRX are 24.75 and 25.7 | Weekly Target 1 | 24.58 | | Weekly Target 2 | 24.92 | | Weekly Target 3 | 25.53 | | Weekly Target 4 | 25.87 | | Weekly Target 5 | 26.48 |
Weekly price and volumes for Brixmor Property
| Date |
Closing |
Open |
Range |
Volume |
Thu 04 December 2025 |
25.26 (-3.37%) |
25.99 |
25.19 - 26.14 |
1.1416 times |
Fri 28 November 2025 |
26.14 (-0.95%) |
26.21 |
25.93 - 26.43 |
0.9914 times |
Fri 21 November 2025 |
26.39 (-0.42%) |
26.61 |
25.74 - 26.78 |
1.0265 times |
Fri 14 November 2025 |
26.50 (-0.86%) |
26.76 |
26.27 - 27.13 |
1.0695 times |
Fri 07 November 2025 |
26.73 (2.18%) |
26.16 |
25.92 - 26.73 |
0.7772 times |
Fri 31 October 2025 |
26.16 (0%) |
26.50 |
26.09 - 26.50 |
0.2507 times |
Fri 31 October 2025 |
26.16 (-7%) |
28.12 |
26.09 - 28.61 |
1.5033 times |
Fri 24 October 2025 |
28.13 (3.34%) |
27.35 |
27.02 - 28.31 |
1.2335 times |
Fri 17 October 2025 |
27.22 (2.6%) |
26.65 |
26.55 - 27.27 |
1.179 times |
Fri 10 October 2025 |
26.53 (-1.34%) |
26.88 |
26.51 - 27.22 |
0.8273 times |
Fri 03 October 2025 |
26.89 (-2.15%) |
27.50 |
26.64 - 27.72 |
0.8254 times |
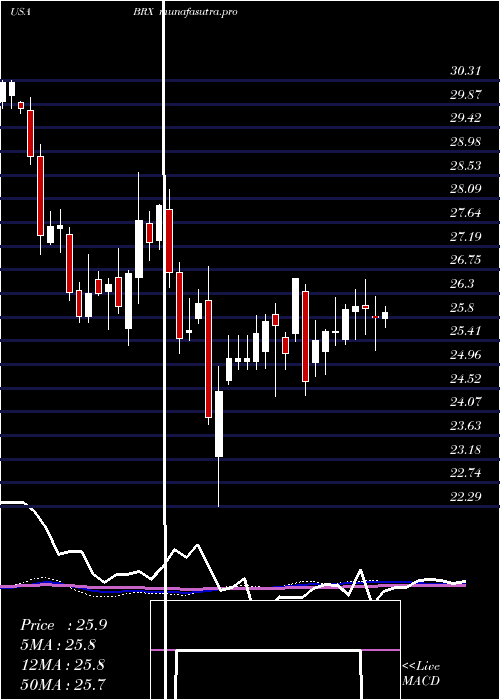
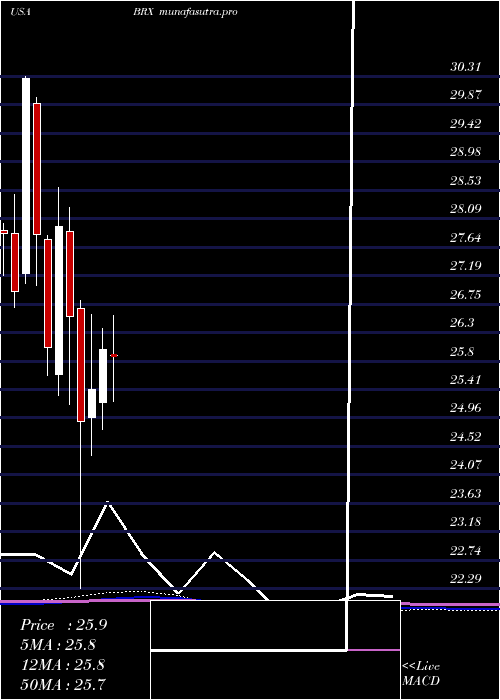
Monthly price and charts BrixmorProperty Strong monthly Stock price targets for BrixmorProperty BRX are 24.75 and 25.7 | Monthly Target 1 | 24.58 | | Monthly Target 2 | 24.92 | | Monthly Target 3 | 25.53 | | Monthly Target 4 | 25.87 | | Monthly Target 5 | 26.48 |
Monthly price and volumes Brixmor Property
| Date |
Closing |
Open |
Range |
Volume |
Thu 04 December 2025 |
25.26 (-3.37%) |
25.99 |
25.19 - 26.14 |
0.277 times |
Fri 28 November 2025 |
26.14 (-0.08%) |
26.16 |
25.74 - 27.13 |
0.9377 times |
Fri 31 October 2025 |
26.16 (-5.49%) |
27.53 |
26.09 - 28.61 |
1.324 times |
Tue 30 September 2025 |
27.68 (-1.11%) |
27.71 |
27.19 - 28.47 |
0.9593 times |
Fri 29 August 2025 |
27.99 (7.12%) |
26.24 |
25.34 - 28.22 |
0.9246 times |
Thu 31 July 2025 |
26.13 (0.35%) |
25.95 |
25.20 - 27.11 |
1.2795 times |
Mon 30 June 2025 |
26.04 (2.48%) |
25.21 |
24.78 - 26.37 |
1.0289 times |
Fri 30 May 2025 |
25.41 (2.01%) |
24.97 |
24.38 - 26.59 |
1.1474 times |
Wed 30 April 2025 |
24.91 (-6.18%) |
26.68 |
22.29 - 26.80 |
1.1248 times |
Mon 31 March 2025 |
26.55 (-5.04%) |
27.88 |
25.17 - 28.26 |
0.9968 times |
Fri 28 February 2025 |
27.96 (7.29%) |
25.64 |
25.32 - 28.58 |
1.1739 times |
DMA SMA EMA moving averages of Brixmor Property BRX
DMA (daily moving average) of Brixmor Property BRX
| DMA period | DMA value | | 5 day DMA | 25.64 | | 12 day DMA | 25.9 | | 20 day DMA | 26.15 | | 35 day DMA | 26.54 | | 50 day DMA | 26.7 | | 100 day DMA | 26.83 | | 150 day DMA | 26.42 | | 200 day DMA | 26.3 | EMA (exponential moving average) of Brixmor Property BRX
| EMA period | EMA current | EMA prev | EMA prev2 | | 5 day EMA | 25.56 | 25.71 | 25.88 | | 12 day EMA | 25.85 | 25.96 | 26.07 | | 20 day EMA | 26.07 | 26.16 | 26.24 | | 35 day EMA | 26.37 | 26.44 | 26.5 | | 50 day EMA | 26.66 | 26.72 | 26.77 |
SMA (simple moving average) of Brixmor Property BRX
| SMA period | SMA current | SMA prev | SMA prev2 | | 5 day SMA | 25.64 | 25.81 | 25.96 | | 12 day SMA | 25.9 | 25.96 | 26.06 | | 20 day SMA | 26.15 | 26.2 | 26.25 | | 35 day SMA | 26.54 | 26.59 | 26.64 | | 50 day SMA | 26.7 | 26.74 | 26.78 | | 100 day SMA | 26.83 | 26.83 | 26.83 | | 150 day SMA | 26.42 | 26.42 | 26.42 | | 200 day SMA | 26.3 | 26.31 | 26.32 |
|
|
