BrtApartments BRT full analysis,charts,indicators,moving averages,SMA,DMA,EMA,ADX,MACD,RSIBrt Apartments BRT WideScreen charts, DMA,SMA,EMA technical analysis, forecast prediction, by indicators ADX,MACD,RSI,CCI USA stock exchange
operates under Consumer Services sector & deals in Real Estate Investment Trusts
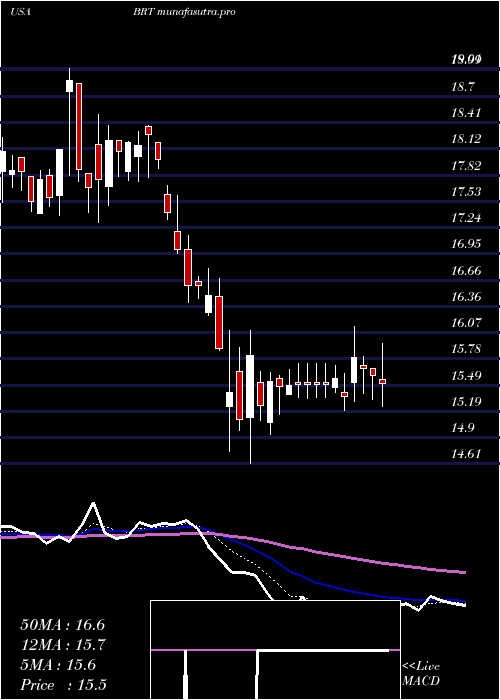
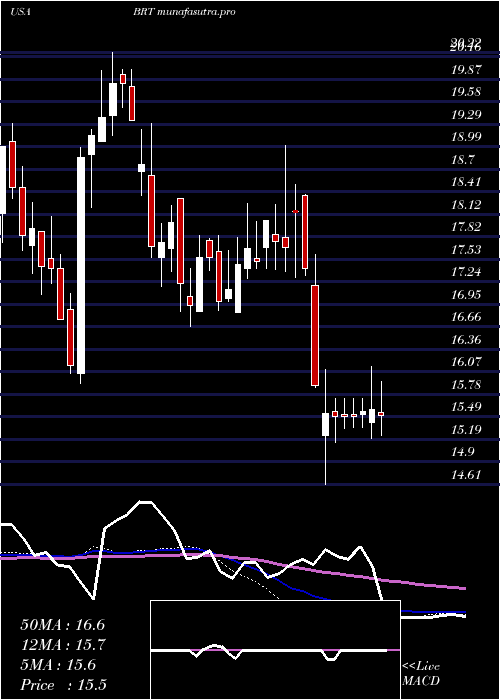
Daily price and charts and targets BrtApartments Strong Daily Stock price targets for BrtApartments BRT are 14.8 and 15.26 | Daily Target 1 | 14.43 | | Daily Target 2 | 14.7 | | Daily Target 3 | 14.893333333333 | | Daily Target 4 | 15.16 | | Daily Target 5 | 15.35 |
Daily price and volume Brt Apartments
| Date |
Closing |
Open |
Range |
Volume |
Mon 20 October 2025 |
14.96 (0.34%) |
14.95 |
14.63 - 15.09 |
0.509 times |
Fri 17 October 2025 |
14.91 (0.47%) |
14.79 |
14.79 - 15.28 |
1.0864 times |
Thu 16 October 2025 |
14.84 (-1%) |
14.99 |
14.74 - 15.13 |
0.8162 times |
Wed 15 October 2025 |
14.99 (0.74%) |
14.98 |
14.90 - 15.14 |
0.8181 times |
Tue 14 October 2025 |
14.88 (0.68%) |
14.73 |
14.52 - 14.94 |
0.8255 times |
Mon 13 October 2025 |
14.78 (0.48%) |
14.81 |
14.53 - 15.03 |
1.9341 times |
Fri 10 October 2025 |
14.71 (-1.74%) |
14.96 |
14.71 - 15.02 |
0.9939 times |
Thu 09 October 2025 |
14.97 (-1.19%) |
15.08 |
14.79 - 15.08 |
1.2956 times |
Wed 08 October 2025 |
15.15 (-0.33%) |
15.33 |
14.98 - 15.34 |
0.3887 times |
Tue 07 October 2025 |
15.20 (-0.39%) |
15.21 |
15.08 - 15.57 |
1.3326 times |
Mon 06 October 2025 |
15.26 (-2.68%) |
15.81 |
15.16 - 15.81 |
0.6321 times |
Weekly price and charts BrtApartments Strong weekly Stock price targets for BrtApartments BRT are 14.8 and 15.26 | Weekly Target 1 | 14.43 | | Weekly Target 2 | 14.7 | | Weekly Target 3 | 14.893333333333 | | Weekly Target 4 | 15.16 | | Weekly Target 5 | 15.35 |
Weekly price and volumes for Brt Apartments
| Date |
Closing |
Open |
Range |
Volume |
Mon 20 October 2025 |
14.96 (0.34%) |
14.95 |
14.63 - 15.09 |
0.192 times |
Fri 17 October 2025 |
14.91 (1.36%) |
14.81 |
14.52 - 15.28 |
2.0675 times |
Fri 10 October 2025 |
14.71 (-6.19%) |
15.81 |
14.71 - 15.81 |
1.7516 times |
Fri 03 October 2025 |
15.68 (-0.13%) |
15.66 |
15.34 - 15.97 |
1.1318 times |
Fri 26 September 2025 |
15.70 (-2.97%) |
16.41 |
15.57 - 16.50 |
0.8526 times |
Fri 19 September 2025 |
16.18 (0.37%) |
16.09 |
16.08 - 16.69 |
1.3392 times |
Fri 12 September 2025 |
16.12 (2.81%) |
15.69 |
15.47 - 16.51 |
0.9796 times |
Fri 05 September 2025 |
15.68 (-2%) |
15.96 |
15.40 - 15.96 |
0.8184 times |
Fri 29 August 2025 |
16.00 (0%) |
15.65 |
15.65 - 16.00 |
0.1815 times |
Fri 29 August 2025 |
16.00 (0.19%) |
15.85 |
15.51 - 16.00 |
0.6857 times |
Fri 22 August 2025 |
15.97 (6.11%) |
15.01 |
15.00 - 16.00 |
0.863 times |
Monthly price and charts BrtApartments Strong monthly Stock price targets for BrtApartments BRT are 14.02 and 15.47 | Monthly Target 1 | 13.7 | | Monthly Target 2 | 14.33 | | Monthly Target 3 | 15.15 | | Monthly Target 4 | 15.78 | | Monthly Target 5 | 16.6 |
Monthly price and volumes Brt Apartments
| Date |
Closing |
Open |
Range |
Volume |
Mon 20 October 2025 |
14.96 (-4.47%) |
15.62 |
14.52 - 15.97 |
1.0252 times |
Tue 30 September 2025 |
15.66 (-2.13%) |
15.96 |
15.40 - 16.69 |
1.035 times |
Fri 29 August 2025 |
16.00 (9.97%) |
14.44 |
14.17 - 16.00 |
0.9624 times |
Thu 31 July 2025 |
14.55 (-6.97%) |
15.58 |
14.53 - 16.21 |
1.0116 times |
Mon 30 June 2025 |
15.64 (-0.76%) |
15.68 |
15.48 - 16.38 |
0.9262 times |
Fri 30 May 2025 |
15.76 (1.87%) |
15.52 |
14.65 - 16.42 |
1.5391 times |
Wed 30 April 2025 |
15.47 (-9%) |
17.00 |
14.61 - 17.15 |
1.1063 times |
Mon 31 March 2025 |
17.00 (-5.76%) |
17.86 |
16.95 - 19.01 |
0.9087 times |
Fri 28 February 2025 |
18.04 (5.25%) |
16.84 |
16.84 - 18.26 |
0.5029 times |
Fri 31 January 2025 |
17.14 (-4.94%) |
17.80 |
16.66 - 18.33 |
0.9828 times |
Tue 31 December 2024 |
18.03 (-9.03%) |
19.78 |
17.18 - 20.00 |
1.0028 times |

DMA SMA EMA moving averages of Brt Apartments BRT
DMA (daily moving average) of Brt Apartments BRT
| DMA period | DMA value | | 5 day DMA | 14.92 | | 12 day DMA | 15.03 | | 20 day DMA | 15.33 | | 35 day DMA | 15.64 | | 50 day DMA | 15.6 | | 100 day DMA | 15.63 | | 150 day DMA | 15.75 | | 200 day DMA | 16.21 | EMA (exponential moving average) of Brt Apartments BRT
| EMA period | EMA current | EMA prev | EMA prev2 | | 5 day EMA | 14.93 | 14.91 | 14.91 | | 12 day EMA | 15.08 | 15.1 | 15.13 | | 20 day EMA | 15.24 | 15.27 | 15.31 | | 35 day EMA | 15.35 | 15.37 | 15.4 | | 50 day EMA | 15.49 | 15.51 | 15.53 |
SMA (simple moving average) of Brt Apartments BRT
| SMA period | SMA current | SMA prev | SMA prev2 | | 5 day SMA | 14.92 | 14.88 | 14.84 | | 12 day SMA | 15.03 | 15.08 | 15.15 | | 20 day SMA | 15.33 | 15.4 | 15.46 | | 35 day SMA | 15.64 | 15.67 | 15.7 | | 50 day SMA | 15.6 | 15.6 | 15.6 | | 100 day SMA | 15.63 | 15.64 | 15.64 | | 150 day SMA | 15.75 | 15.77 | 15.79 | | 200 day SMA | 16.21 | 16.22 | 16.24 |
|
|
