BrooklineBancorp BRKL full analysis,charts,indicators,moving averages,SMA,DMA,EMA,ADX,MACD,RSIBrookline Bancorp BRKL WideScreen charts, DMA,SMA,EMA technical analysis, forecast prediction, by indicators ADX,MACD,RSI,CCI USA stock exchange
operates under Finance sector & deals in Savings Institutions
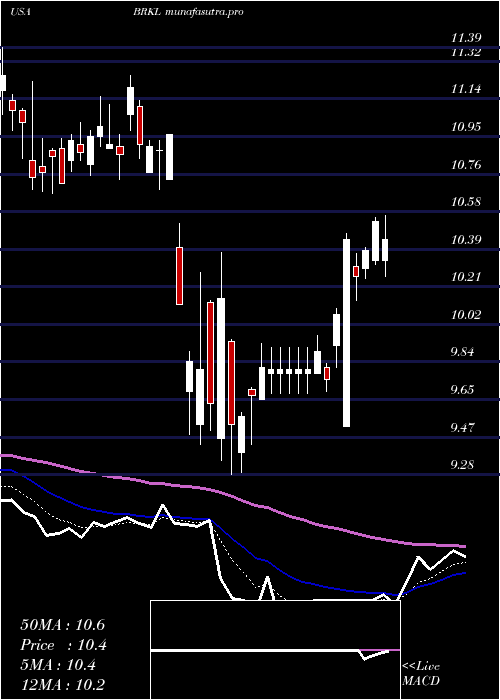
Daily price and charts and targets BrooklineBancorp Strong Daily Stock price targets for BrooklineBancorp BRKL are 10.76 and 11.06 | Daily Target 1 | 10.7 | | Daily Target 2 | 10.82 | | Daily Target 3 | 10.996666666667 | | Daily Target 4 | 11.12 | | Daily Target 5 | 11.3 |
Daily price and volume Brookline Bancorp
| Date |
Closing |
Open |
Range |
Volume |
Fri 29 August 2025 |
10.95 (0%) |
11.06 |
10.87 - 11.17 |
3.1719 times |
Fri 29 August 2025 |
10.95 (-0.64%) |
11.06 |
10.87 - 11.17 |
3.1719 times |
Thu 28 August 2025 |
11.02 (-0.9%) |
11.15 |
11.00 - 11.22 |
0.829 times |
Wed 27 August 2025 |
11.12 (-0.54%) |
11.15 |
11.05 - 11.22 |
0.5229 times |
Tue 26 August 2025 |
11.18 (1.36%) |
11.00 |
11.00 - 11.24 |
0.3261 times |
Mon 25 August 2025 |
11.03 (-1.16%) |
11.14 |
11.02 - 11.16 |
0.2115 times |
Fri 22 August 2025 |
11.16 (5.08%) |
10.68 |
10.68 - 11.18 |
1.0335 times |
Thu 21 August 2025 |
10.62 (-0.09%) |
10.56 |
10.55 - 10.64 |
0.1804 times |
Wed 20 August 2025 |
10.63 (0.47%) |
10.58 |
10.57 - 10.66 |
0.2061 times |
Tue 19 August 2025 |
10.58 (0.47%) |
10.53 |
10.53 - 10.70 |
0.3466 times |
Mon 18 August 2025 |
10.53 (-0.28%) |
10.53 |
10.43 - 10.58 |
0.122 times |
Weekly price and charts BrooklineBancorp Strong weekly Stock price targets for BrooklineBancorp BRKL are 10.76 and 11.06 | Weekly Target 1 | 10.7 | | Weekly Target 2 | 10.82 | | Weekly Target 3 | 10.996666666667 | | Weekly Target 4 | 11.12 | | Weekly Target 5 | 11.3 |
Weekly price and volumes for Brookline Bancorp
| Date |
Closing |
Open |
Range |
Volume |
Fri 29 August 2025 |
10.95 (0%) |
11.06 |
10.87 - 11.17 |
1.526 times |
Fri 29 August 2025 |
10.95 (-1.88%) |
11.14 |
10.87 - 11.24 |
2.435 times |
Fri 22 August 2025 |
11.16 (5.68%) |
10.53 |
10.43 - 11.18 |
0.9086 times |
Fri 15 August 2025 |
10.56 (4.04%) |
10.18 |
10.09 - 10.93 |
0.7726 times |
Fri 08 August 2025 |
10.15 (-0.39%) |
10.31 |
9.92 - 10.36 |
0.5809 times |
Fri 01 August 2025 |
10.19 (-5.82%) |
10.82 |
10.01 - 10.88 |
0.5705 times |
Fri 25 July 2025 |
10.82 (-2.43%) |
11.12 |
10.71 - 11.21 |
0.905 times |
Fri 18 July 2025 |
11.09 (0.82%) |
10.95 |
10.73 - 11.36 |
0.9719 times |
Fri 11 July 2025 |
11.00 (-2.65%) |
11.27 |
10.98 - 11.39 |
0.6346 times |
Thu 03 July 2025 |
11.30 (6.4%) |
10.70 |
10.52 - 11.38 |
0.6948 times |
Fri 27 June 2025 |
10.62 (5.78%) |
10.00 |
9.98 - 10.69 |
0.7472 times |

Monthly price and charts BrooklineBancorp Strong monthly Stock price targets for BrooklineBancorp BRKL are 10.44 and 11.76 | Monthly Target 1 | 9.38 | | Monthly Target 2 | 10.17 | | Monthly Target 3 | 10.703333333333 | | Monthly Target 4 | 11.49 | | Monthly Target 5 | 12.02 |
Monthly price and volumes Brookline Bancorp
| Date |
Closing |
Open |
Range |
Volume |
Fri 29 August 2025 |
10.95 (6.1%) |
10.16 |
9.92 - 11.24 |
1.8168 times |
Thu 31 July 2025 |
10.32 (-2.18%) |
10.53 |
10.24 - 11.39 |
0.9866 times |
Mon 30 June 2025 |
10.55 (2.13%) |
10.33 |
9.98 - 10.75 |
0.8468 times |
Fri 30 May 2025 |
10.33 (-1.05%) |
10.49 |
10.21 - 11.17 |
0.773 times |
Wed 30 April 2025 |
10.44 (-4.22%) |
10.88 |
9.28 - 10.96 |
0.9254 times |
Mon 31 March 2025 |
10.90 (-7.63%) |
11.83 |
10.67 - 11.93 |
0.73 times |
Fri 28 February 2025 |
11.80 (-3.52%) |
11.99 |
11.55 - 12.71 |
0.7153 times |
Fri 31 January 2025 |
12.23 (3.73%) |
11.92 |
11.09 - 12.49 |
0.981 times |
Tue 31 December 2024 |
11.79 (-7.6%) |
12.63 |
11.47 - 12.88 |
1.2142 times |
Tue 26 November 2024 |
12.76 (13.42%) |
11.27 |
10.90 - 13.15 |
1.0109 times |
Thu 31 October 2024 |
11.25 (11.5%) |
10.05 |
9.58 - 11.63 |
0.8399 times |

DMA SMA EMA moving averages of Brookline Bancorp BRKL
DMA (daily moving average) of Brookline Bancorp BRKL
| DMA period | DMA value | | 5 day DMA | 11.04 | | 12 day DMA | 10.86 | | 20 day DMA | 10.68 | | 35 day DMA | 10.74 | | 50 day DMA | 10.76 | | 100 day DMA | 10.56 | | 150 day DMA | 10.86 | | 200 day DMA | 11.16 | EMA (exponential moving average) of Brookline Bancorp BRKL
| EMA period | EMA current | EMA prev | EMA prev2 | | 5 day EMA | 10.98 | 11 | 11.02 | | 12 day EMA | 10.89 | 10.88 | 10.87 | | 20 day EMA | 10.82 | 10.81 | 10.79 | | 35 day EMA | 10.77 | 10.76 | 10.75 | | 50 day EMA | 10.75 | 10.74 | 10.73 |
SMA (simple moving average) of Brookline Bancorp BRKL
| SMA period | SMA current | SMA prev | SMA prev2 | | 5 day SMA | 11.04 | 11.06 | 11.1 | | 12 day SMA | 10.86 | 10.84 | 10.84 | | 20 day SMA | 10.68 | 10.64 | 10.61 | | 35 day SMA | 10.74 | 10.74 | 10.75 | | 50 day SMA | 10.76 | 10.74 | 10.72 | | 100 day SMA | 10.56 | 10.55 | 10.54 | | 150 day SMA | 10.86 | 10.86 | 10.87 | | 200 day SMA | 11.16 | 11.16 | 11.17 |
|
|
