BpP BP full analysis,charts,indicators,moving averages,SMA,DMA,EMA,ADX,MACD,RSIBp P BP WideScreen charts, DMA,SMA,EMA technical analysis, forecast prediction, by indicators ADX,MACD,RSI,CCI USA stock exchange
operates under Energy sector & deals in Integrated Oil Companies
Daily price and charts and targets BpP Strong Daily Stock price targets for BpP BP are 37.07 and 37.63 | Daily Target 1 | 36.63 | | Daily Target 2 | 36.94 | | Daily Target 3 | 37.19 | | Daily Target 4 | 37.5 | | Daily Target 5 | 37.75 |
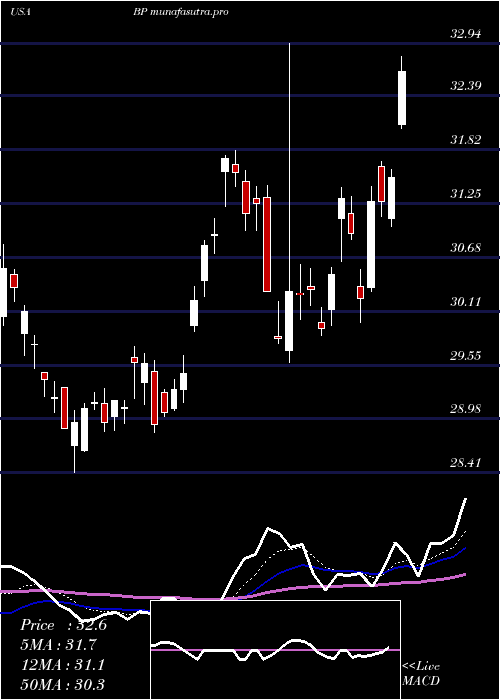
Daily price and volume Bp P
| Date |
Closing |
Open |
Range |
Volume |
Thu 04 December 2025 |
37.25 (0.03%) |
37.07 |
36.88 - 37.44 |
1.2565 times |
Wed 03 December 2025 |
37.24 (2.42%) |
36.69 |
36.69 - 37.26 |
1.0369 times |
Tue 02 December 2025 |
36.36 (-0.41%) |
36.48 |
36.18 - 36.52 |
0.6881 times |
Mon 01 December 2025 |
36.51 (1.14%) |
36.39 |
36.34 - 36.72 |
0.8903 times |
Fri 28 November 2025 |
36.10 (0.5%) |
35.82 |
35.80 - 36.21 |
0.5371 times |
Wed 26 November 2025 |
35.92 (0.64%) |
35.73 |
35.67 - 36.11 |
0.6309 times |
Tue 25 November 2025 |
35.69 (-0.58%) |
35.77 |
35.51 - 35.94 |
1.0078 times |
Mon 24 November 2025 |
35.90 (-0.22%) |
35.81 |
35.42 - 35.97 |
0.9954 times |
Fri 21 November 2025 |
35.98 (0.73%) |
35.53 |
35.40 - 36.11 |
1.6378 times |
Thu 20 November 2025 |
35.72 (-0.64%) |
36.05 |
35.63 - 36.41 |
1.3193 times |
Wed 19 November 2025 |
35.95 (-2.02%) |
35.65 |
35.62 - 35.98 |
1.3393 times |
Weekly price and charts BpP Strong weekly Stock price targets for BpP BP are 36.72 and 37.98 | Weekly Target 1 | 35.7 | | Weekly Target 2 | 36.47 | | Weekly Target 3 | 36.956666666667 | | Weekly Target 4 | 37.73 | | Weekly Target 5 | 38.22 |
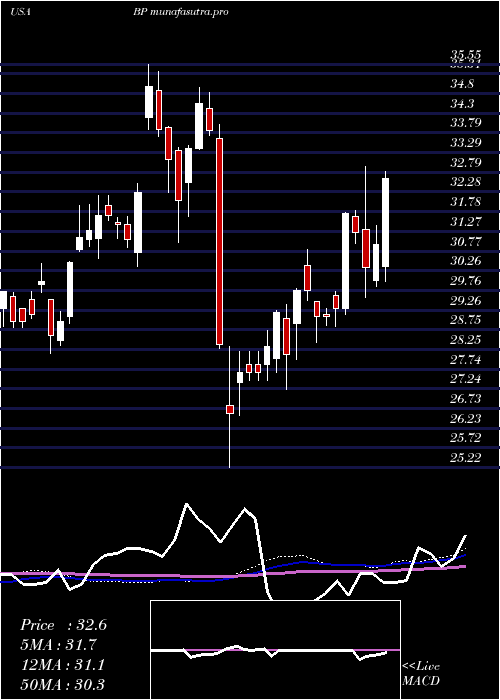
Weekly price and volumes for Bp P
| Date |
Closing |
Open |
Range |
Volume |
Thu 04 December 2025 |
37.25 (3.19%) |
36.39 |
36.18 - 37.44 |
0.7729 times |
Fri 28 November 2025 |
36.10 (0.33%) |
35.81 |
35.42 - 36.21 |
0.633 times |
Fri 21 November 2025 |
35.98 (-1.51%) |
36.53 |
35.40 - 36.99 |
1.5009 times |
Fri 14 November 2025 |
36.53 (-0.19%) |
36.60 |
35.90 - 37.64 |
1.2447 times |
Fri 07 November 2025 |
36.60 (4.18%) |
35.11 |
34.61 - 36.60 |
1.0932 times |
Fri 31 October 2025 |
35.13 (0%) |
34.86 |
34.59 - 35.15 |
0.2166 times |
Fri 31 October 2025 |
35.13 (1.71%) |
34.77 |
34.44 - 35.47 |
1.2634 times |
Fri 24 October 2025 |
34.54 (4.26%) |
33.07 |
32.93 - 35.13 |
1.1078 times |
Fri 17 October 2025 |
33.13 (-1.07%) |
33.70 |
32.71 - 33.95 |
1.0978 times |
Fri 10 October 2025 |
33.49 (-1.99%) |
34.55 |
33.47 - 35.10 |
1.0696 times |
Fri 03 October 2025 |
34.17 (-4.26%) |
35.27 |
33.85 - 35.30 |
1.0443 times |
Monthly price and charts BpP Strong monthly Stock price targets for BpP BP are 36.72 and 37.98 | Monthly Target 1 | 35.7 | | Monthly Target 2 | 36.47 | | Monthly Target 3 | 36.956666666667 | | Monthly Target 4 | 37.73 | | Monthly Target 5 | 38.22 |
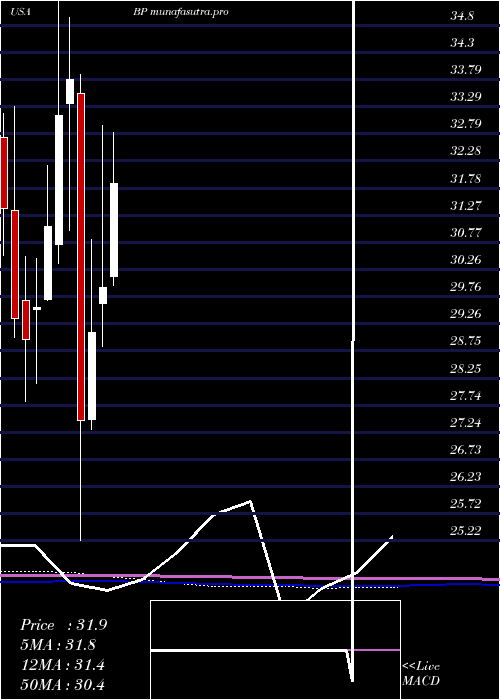
Monthly price and volumes Bp P
| Date |
Closing |
Open |
Range |
Volume |
Thu 04 December 2025 |
37.25 (3.19%) |
36.39 |
36.18 - 37.44 |
0.1231 times |
Fri 28 November 2025 |
36.10 (2.76%) |
35.11 |
34.61 - 37.64 |
0.7121 times |
Fri 31 October 2025 |
35.13 (1.94%) |
34.66 |
32.71 - 35.47 |
0.853 times |
Tue 30 September 2025 |
34.46 (-2.19%) |
34.77 |
33.69 - 35.88 |
0.84 times |
Fri 29 August 2025 |
35.23 (9.58%) |
32.04 |
31.58 - 35.43 |
0.943 times |
Thu 31 July 2025 |
32.15 (7.42%) |
30.13 |
29.96 - 33.06 |
0.9529 times |
Mon 30 June 2025 |
29.93 (2.85%) |
29.63 |
28.83 - 32.94 |
1.4233 times |
Fri 30 May 2025 |
29.10 (5.97%) |
27.47 |
27.30 - 30.82 |
1.32 times |
Wed 30 April 2025 |
27.46 (-18.73%) |
33.54 |
25.22 - 33.89 |
1.4367 times |
Mon 31 March 2025 |
33.79 (2.02%) |
33.34 |
30.99 - 34.95 |
1.3958 times |
Fri 28 February 2025 |
33.12 (6.63%) |
30.72 |
30.37 - 35.55 |
1.7031 times |
DMA SMA EMA moving averages of Bp P BP
DMA (daily moving average) of Bp P BP
| DMA period | DMA value | | 5 day DMA | 36.69 | | 12 day DMA | 36.28 | | 20 day DMA | 36.43 | | 35 day DMA | 35.57 | | 50 day DMA | 35.2 | | 100 day DMA | 34.53 | | 150 day DMA | 33.02 | | 200 day DMA | 32.53 | EMA (exponential moving average) of Bp P BP
| EMA period | EMA current | EMA prev | EMA prev2 | | 5 day EMA | 36.8 | 36.57 | 36.23 | | 12 day EMA | 36.45 | 36.31 | 36.14 | | 20 day EMA | 36.21 | 36.1 | 35.98 | | 35 day EMA | 35.79 | 35.7 | 35.61 | | 50 day EMA | 35.3 | 35.22 | 35.14 |
SMA (simple moving average) of Bp P BP
| SMA period | SMA current | SMA prev | SMA prev2 | | 5 day SMA | 36.69 | 36.43 | 36.12 | | 12 day SMA | 36.28 | 36.21 | 36.15 | | 20 day SMA | 36.43 | 36.35 | 36.25 | | 35 day SMA | 35.57 | 35.46 | 35.34 | | 50 day SMA | 35.2 | 35.16 | 35.11 | | 100 day SMA | 34.53 | 34.47 | 34.42 | | 150 day SMA | 33.02 | 32.96 | 32.9 | | 200 day SMA | 32.53 | 32.52 | 32.51 |
|
|
