BO BOSC full analysis,charts,indicators,moving averages,SMA,DMA,EMA,ADX,MACD,RSIB O BOSC WideScreen charts, DMA,SMA,EMA technical analysis, forecast prediction, by indicators ADX,MACD,RSI,CCI USA stock exchange
operates under Technology sector & deals in Computer Communications Equipment
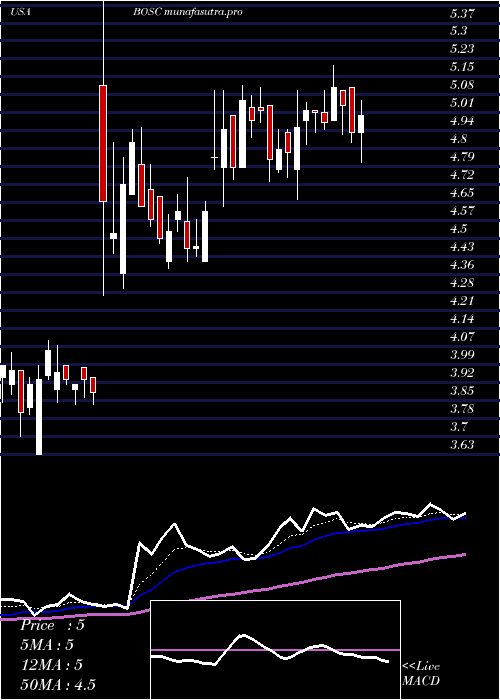
Daily price and charts and targets BO Strong Daily Stock price targets for BO BOSC are 4.71 and 5.1 | Daily Target 1 | 4.4 | | Daily Target 2 | 4.63 | | Daily Target 3 | 4.7933333333333 | | Daily Target 4 | 5.02 | | Daily Target 5 | 5.18 |
Daily price and volume B O
| Date |
Closing |
Open |
Range |
Volume |
Thu 04 December 2025 |
4.85 (5.21%) |
4.65 |
4.57 - 4.96 |
1.5067 times |
Wed 03 December 2025 |
4.61 (4.77%) |
4.39 |
4.36 - 4.64 |
1.1226 times |
Tue 02 December 2025 |
4.40 (-0.9%) |
4.45 |
4.36 - 4.55 |
1.0898 times |
Mon 01 December 2025 |
4.44 (-4.72%) |
4.56 |
4.41 - 4.70 |
0.8904 times |
Fri 28 November 2025 |
4.66 (-1.06%) |
4.67 |
4.61 - 4.81 |
0.2651 times |
Wed 26 November 2025 |
4.71 (-1.67%) |
4.78 |
4.65 - 4.83 |
0.6909 times |
Tue 25 November 2025 |
4.79 (10.11%) |
4.45 |
4.35 - 5.00 |
1.6926 times |
Mon 24 November 2025 |
4.35 (-0.46%) |
4.40 |
4.34 - 4.50 |
0.9219 times |
Fri 21 November 2025 |
4.37 (1.16%) |
4.34 |
4.34 - 4.56 |
0.4889 times |
Thu 20 November 2025 |
4.32 (-5.47%) |
4.51 |
4.32 - 4.70 |
1.3311 times |
Wed 19 November 2025 |
4.57 (-3.59%) |
4.75 |
4.53 - 4.82 |
0.7501 times |
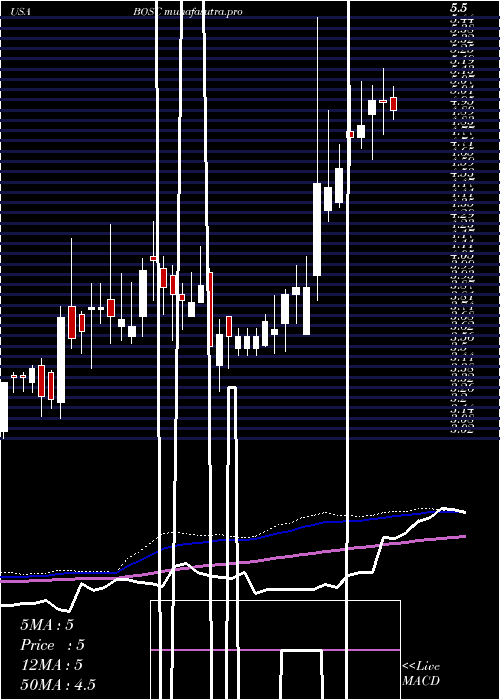
Weekly price and charts BO Strong weekly Stock price targets for BO BOSC are 4.61 and 5.21 | Weekly Target 1 | 4.12 | | Weekly Target 2 | 4.49 | | Weekly Target 3 | 4.7233333333333 | | Weekly Target 4 | 5.09 | | Weekly Target 5 | 5.32 |
Weekly price and volumes for B O
| Date |
Closing |
Open |
Range |
Volume |
Thu 04 December 2025 |
4.85 (4.08%) |
4.56 |
4.36 - 4.96 |
1.063 times |
Fri 28 November 2025 |
4.66 (6.64%) |
4.40 |
4.34 - 5.00 |
0.8234 times |
Fri 21 November 2025 |
4.37 (-11.9%) |
4.96 |
4.32 - 5.10 |
0.9688 times |
Fri 14 November 2025 |
4.96 (-6.06%) |
5.28 |
4.90 - 5.32 |
0.8707 times |
Fri 07 November 2025 |
5.28 (-11.26%) |
6.72 |
5.20 - 6.72 |
1.4172 times |
Fri 31 October 2025 |
5.95 (0%) |
5.71 |
5.68 - 5.98 |
0.4089 times |
Fri 31 October 2025 |
5.95 (19.96%) |
5.00 |
4.88 - 5.98 |
2.933 times |
Fri 24 October 2025 |
4.96 (1.43%) |
4.91 |
4.80 - 5.15 |
0.411 times |
Fri 17 October 2025 |
4.89 (3.38%) |
4.81 |
4.66 - 5.08 |
0.7524 times |
Fri 10 October 2025 |
4.73 (-0.63%) |
4.78 |
4.67 - 4.95 |
0.3516 times |
Fri 03 October 2025 |
4.76 (-0.42%) |
4.72 |
4.64 - 4.85 |
0.3157 times |
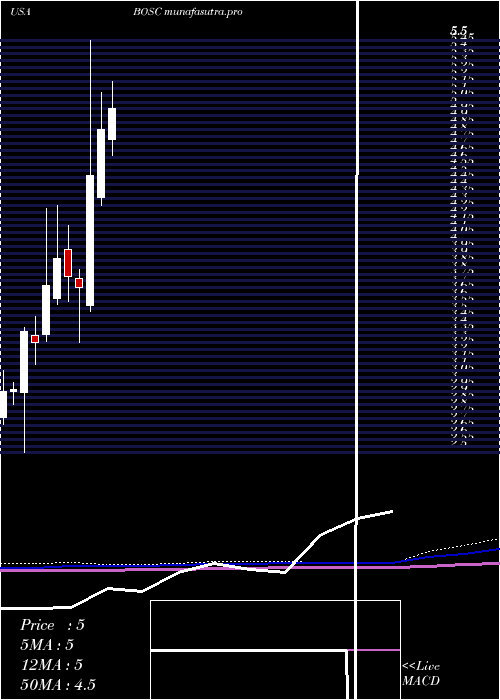
Monthly price and charts BO Strong monthly Stock price targets for BO BOSC are 4.61 and 5.21 | Monthly Target 1 | 4.12 | | Monthly Target 2 | 4.49 | | Monthly Target 3 | 4.7233333333333 | | Monthly Target 4 | 5.09 | | Monthly Target 5 | 5.32 |
Monthly price and volumes B O
| Date |
Closing |
Open |
Range |
Volume |
Thu 04 December 2025 |
4.85 (4.08%) |
4.56 |
4.36 - 4.96 |
0.2998 times |
Fri 28 November 2025 |
4.66 (-21.68%) |
6.72 |
4.32 - 6.72 |
1.1508 times |
Fri 31 October 2025 |
5.95 (25%) |
4.71 |
4.66 - 5.98 |
1.4069 times |
Tue 30 September 2025 |
4.76 (-0.83%) |
4.69 |
4.60 - 5.30 |
0.5912 times |
Fri 29 August 2025 |
4.80 (-2.04%) |
4.87 |
4.54 - 5.04 |
0.537 times |
Thu 31 July 2025 |
4.90 (1.03%) |
4.78 |
4.66 - 5.37 |
1.0422 times |
Mon 30 June 2025 |
4.85 (7.3%) |
4.36 |
4.30 - 5.12 |
1.0657 times |
Fri 30 May 2025 |
4.52 (22.16%) |
3.57 |
3.53 - 5.50 |
3.6171 times |
Wed 30 April 2025 |
3.70 (-2.12%) |
3.77 |
3.30 - 3.83 |
0.1723 times |
Mon 31 March 2025 |
3.78 (-3.32%) |
3.98 |
3.60 - 4.15 |
0.117 times |
Fri 28 February 2025 |
3.91 (5.11%) |
3.62 |
3.58 - 4.30 |
0.5528 times |
DMA SMA EMA moving averages of B O BOSC
DMA (daily moving average) of B O BOSC
| DMA period | DMA value | | 5 day DMA | 4.59 | | 12 day DMA | 4.57 | | 20 day DMA | 4.82 | | 35 day DMA | 5.07 | | 50 day DMA | 4.99 | | 100 day DMA | 4.93 | | 150 day DMA | 4.77 | | 200 day DMA | 4.52 | EMA (exponential moving average) of B O BOSC
| EMA period | EMA current | EMA prev | EMA prev2 | | 5 day EMA | 4.64 | 4.54 | 4.51 | | 12 day EMA | 4.69 | 4.66 | 4.67 | | 20 day EMA | 4.8 | 4.8 | 4.82 | | 35 day EMA | 4.83 | 4.83 | 4.84 | | 50 day EMA | 4.95 | 4.95 | 4.96 |
SMA (simple moving average) of B O BOSC
| SMA period | SMA current | SMA prev | SMA prev2 | | 5 day SMA | 4.59 | 4.56 | 4.6 | | 12 day SMA | 4.57 | 4.58 | 4.6 | | 20 day SMA | 4.82 | 4.91 | 5 | | 35 day SMA | 5.07 | 5.08 | 5.08 | | 50 day SMA | 4.99 | 4.98 | 4.98 | | 100 day SMA | 4.93 | 4.93 | 4.93 | | 150 day SMA | 4.77 | 4.76 | 4.76 | | 200 day SMA | 4.52 | 4.52 | 4.51 |
|
|
