BootBarn BOOT full analysis,charts,indicators,moving averages,SMA,DMA,EMA,ADX,MACD,RSIBoot Barn BOOT WideScreen charts, DMA,SMA,EMA technical analysis, forecast prediction, by indicators ADX,MACD,RSI,CCI USA stock exchange
operates under Consumer Services sector & deals in Clothing Shoe Accessory Stores
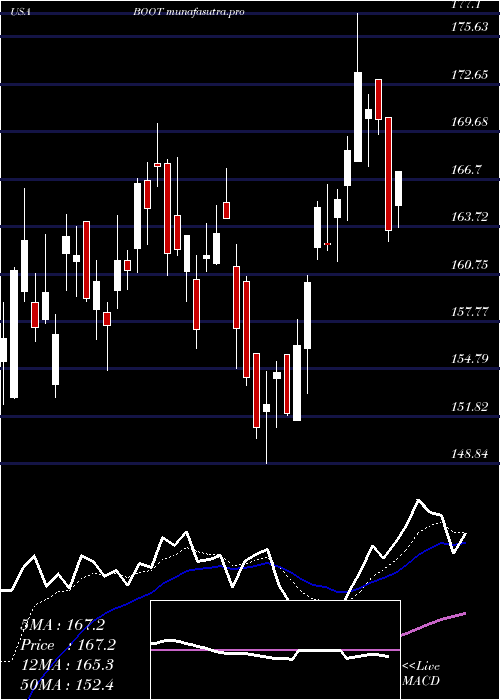
Daily price and charts and targets BootBarn Strong Daily Stock price targets for BootBarn BOOT are 199.81 and 206.77 | Daily Target 1 | 194.37 | | Daily Target 2 | 198.28 | | Daily Target 3 | 201.33333333333 | | Daily Target 4 | 205.24 | | Daily Target 5 | 208.29 |
Daily price and volume Boot Barn
| Date |
Closing |
Open |
Range |
Volume |
Fri 05 December 2025 |
202.18 (2.01%) |
197.43 |
197.43 - 204.39 |
0.8777 times |
Thu 04 December 2025 |
198.20 (-1.42%) |
199.66 |
194.04 - 201.87 |
0.6037 times |
Wed 03 December 2025 |
201.06 (3.62%) |
196.47 |
194.02 - 201.60 |
0.9447 times |
Tue 02 December 2025 |
194.04 (-0.55%) |
195.68 |
194.00 - 198.01 |
1.1401 times |
Mon 01 December 2025 |
195.12 (0.67%) |
191.41 |
190.63 - 197.14 |
0.9551 times |
Fri 28 November 2025 |
193.82 (-0.15%) |
196.63 |
192.85 - 196.63 |
0.3323 times |
Wed 26 November 2025 |
194.11 (-0.84%) |
194.95 |
194.03 - 198.53 |
1.4552 times |
Tue 25 November 2025 |
195.76 (6.13%) |
185.81 |
183.53 - 197.47 |
1.3781 times |
Mon 24 November 2025 |
184.45 (0.3%) |
181.84 |
180.42 - 187.99 |
1.0297 times |
Fri 21 November 2025 |
183.90 (6.26%) |
174.59 |
174.59 - 187.11 |
1.2833 times |
Thu 20 November 2025 |
173.07 (-1.4%) |
177.54 |
172.28 - 180.97 |
0.6699 times |
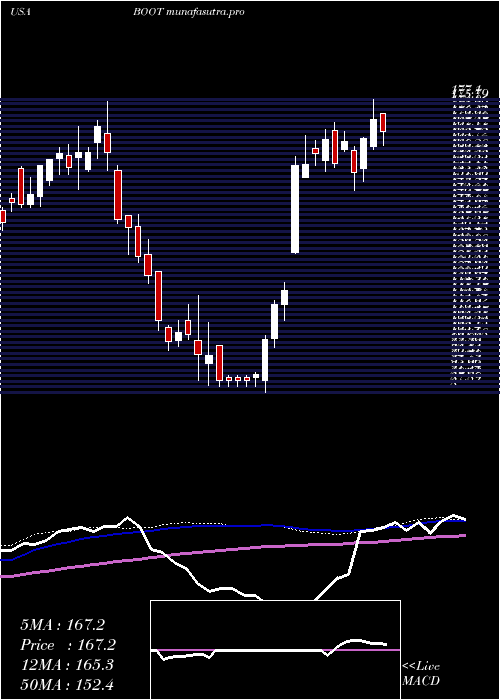
Weekly price and charts BootBarn Strong weekly Stock price targets for BootBarn BOOT are 196.41 and 210.17 | Weekly Target 1 | 185.31 | | Weekly Target 2 | 193.74 | | Weekly Target 3 | 199.06666666667 | | Weekly Target 4 | 207.5 | | Weekly Target 5 | 212.83 |
Weekly price and volumes for Boot Barn
| Date |
Closing |
Open |
Range |
Volume |
Fri 05 December 2025 |
202.18 (4.31%) |
191.41 |
190.63 - 204.39 |
0.9274 times |
Fri 28 November 2025 |
193.82 (5.39%) |
181.84 |
180.42 - 198.53 |
0.8605 times |
Fri 21 November 2025 |
183.90 (6.22%) |
172.55 |
168.19 - 187.11 |
0.8452 times |
Fri 14 November 2025 |
173.13 (-7.26%) |
189.00 |
172.75 - 191.02 |
0.8982 times |
Fri 07 November 2025 |
186.68 (-1.57%) |
185.83 |
181.27 - 191.09 |
1.0345 times |
Fri 31 October 2025 |
189.65 (0%) |
187.02 |
183.58 - 191.16 |
0.2783 times |
Fri 31 October 2025 |
189.65 (-3.72%) |
201.56 |
182.24 - 205.31 |
2.1122 times |
Fri 24 October 2025 |
196.97 (6.48%) |
187.05 |
185.31 - 199.50 |
1.0809 times |
Fri 17 October 2025 |
184.99 (12.92%) |
167.23 |
165.89 - 190.06 |
1.1352 times |
Fri 10 October 2025 |
163.82 (-4.41%) |
172.49 |
163.43 - 175.27 |
0.8276 times |
Fri 03 October 2025 |
171.38 (1.3%) |
169.79 |
162.10 - 172.59 |
1.2018 times |
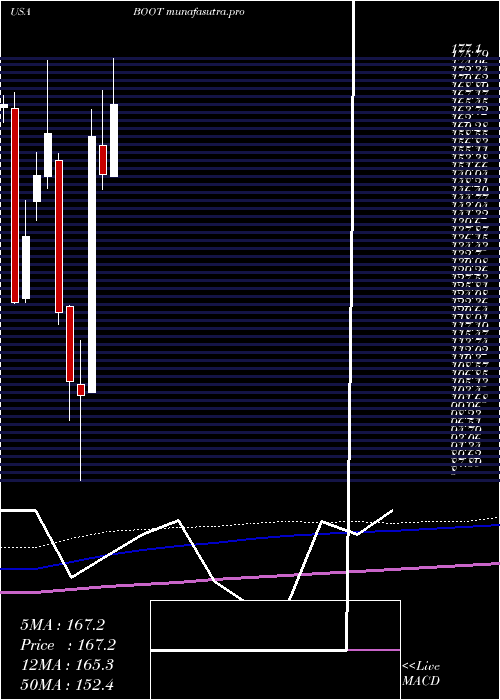
Monthly price and charts BootBarn Strong monthly Stock price targets for BootBarn BOOT are 196.41 and 210.17 | Monthly Target 1 | 185.31 | | Monthly Target 2 | 193.74 | | Monthly Target 3 | 199.06666666667 | | Monthly Target 4 | 207.5 | | Monthly Target 5 | 212.83 |
Monthly price and volumes Boot Barn
| Date |
Closing |
Open |
Range |
Volume |
Fri 05 December 2025 |
202.18 (4.31%) |
191.41 |
190.63 - 204.39 |
0.1561 times |
Fri 28 November 2025 |
193.82 (2.2%) |
185.83 |
168.19 - 198.53 |
0.6123 times |
Fri 31 October 2025 |
189.65 (14.44%) |
165.34 |
162.10 - 205.31 |
1.0245 times |
Tue 30 September 2025 |
165.72 (-6.78%) |
175.32 |
163.60 - 191.31 |
0.7817 times |
Fri 29 August 2025 |
177.77 (3.41%) |
182.76 |
160.99 - 183.60 |
0.8876 times |
Thu 31 July 2025 |
171.90 (13.09%) |
151.58 |
151.58 - 179.89 |
1.107 times |
Mon 30 June 2025 |
152.00 (-5.18%) |
158.35 |
148.84 - 170.16 |
0.8629 times |
Fri 30 May 2025 |
160.31 (53.64%) |
105.16 |
105.07 - 166.10 |
1.5964 times |
Wed 30 April 2025 |
104.34 (-2.88%) |
106.73 |
86.17 - 116.37 |
1.7308 times |
Mon 31 March 2025 |
107.43 (-12.25%) |
123.65 |
99.07 - 123.80 |
1.2408 times |
Fri 28 February 2025 |
122.43 (-23.89%) |
155.02 |
119.82 - 156.54 |
1.3837 times |
DMA SMA EMA moving averages of Boot Barn BOOT
DMA (daily moving average) of Boot Barn BOOT
| DMA period | DMA value | | 5 day DMA | 198.12 | | 12 day DMA | 190.94 | | 20 day DMA | 186.15 | | 35 day DMA | 188.13 | | 50 day DMA | 183.21 | | 100 day DMA | 178.73 | | 150 day DMA | 170.48 | | 200 day DMA | 154.04 | EMA (exponential moving average) of Boot Barn BOOT
| EMA period | EMA current | EMA prev | EMA prev2 | | 5 day EMA | 198.26 | 196.3 | 195.35 | | 12 day EMA | 193.03 | 191.37 | 190.13 | | 20 day EMA | 189.91 | 188.62 | 187.61 | | 35 day EMA | 185.86 | 184.9 | 184.12 | | 50 day EMA | 183.83 | 183.08 | 182.46 |
SMA (simple moving average) of Boot Barn BOOT
| SMA period | SMA current | SMA prev | SMA prev2 | | 5 day SMA | 198.12 | 196.45 | 195.63 | | 12 day SMA | 190.94 | 188.35 | 186.11 | | 20 day SMA | 186.15 | 185.18 | 184.63 | | 35 day SMA | 188.13 | 187.7 | 187.42 | | 50 day SMA | 183.21 | 182.57 | 181.97 | | 100 day SMA | 178.73 | 178.38 | 178.03 | | 150 day SMA | 170.48 | 169.85 | 169.22 | | 200 day SMA | 154.04 | 153.69 | 153.37 |
|
|
