BokFinancial BOKF full analysis,charts,indicators,moving averages,SMA,DMA,EMA,ADX,MACD,RSIBok Financial BOKF WideScreen charts, DMA,SMA,EMA technical analysis, forecast prediction, by indicators ADX,MACD,RSI,CCI USA stock exchange
operates under Finance sector & deals in Major Banks
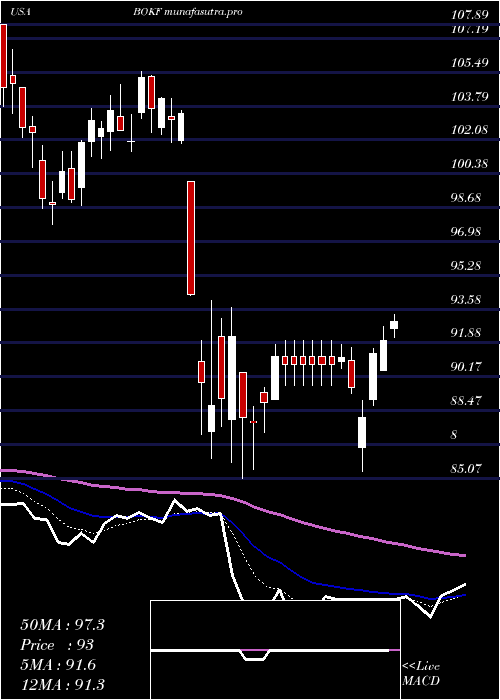
Daily price and charts and targets BokFinancial Strong Daily Stock price targets for BokFinancial BOKF are 116.19 and 117.54 | Daily Target 1 | 115.19 | | Daily Target 2 | 115.83 | | Daily Target 3 | 116.53666666667 | | Daily Target 4 | 117.18 | | Daily Target 5 | 117.89 |
Daily price and volume Bok Financial
| Date |
Closing |
Open |
Range |
Volume |
Thu 04 December 2025 |
116.48 (-0.05%) |
115.99 |
115.89 - 117.24 |
0.8512 times |
Wed 03 December 2025 |
116.54 (1.48%) |
114.42 |
114.24 - 118.03 |
1.0015 times |
Tue 02 December 2025 |
114.84 (0.1%) |
115.44 |
114.51 - 115.99 |
0.858 times |
Mon 01 December 2025 |
114.73 (1.87%) |
112.40 |
111.54 - 115.50 |
1.0051 times |
Fri 28 November 2025 |
112.62 (-0.81%) |
113.97 |
112.46 - 113.97 |
0.5301 times |
Wed 26 November 2025 |
113.54 (0.18%) |
112.86 |
112.50 - 114.76 |
1.1297 times |
Tue 25 November 2025 |
113.34 (3.47%) |
109.93 |
109.93 - 114.00 |
0.9581 times |
Mon 24 November 2025 |
109.54 (0%) |
109.52 |
108.69 - 110.62 |
1.1429 times |
Fri 21 November 2025 |
109.54 (3.47%) |
106.98 |
106.80 - 110.82 |
1.3314 times |
Thu 20 November 2025 |
105.87 (-0.6%) |
107.02 |
105.57 - 108.70 |
1.192 times |
Wed 19 November 2025 |
106.51 (1.49%) |
104.77 |
104.65 - 106.88 |
0.9975 times |
Weekly price and charts BokFinancial Strong weekly Stock price targets for BokFinancial BOKF are 114.01 and 120.5 | Weekly Target 1 | 108.86 | | Weekly Target 2 | 112.67 | | Weekly Target 3 | 115.35 | | Weekly Target 4 | 119.16 | | Weekly Target 5 | 121.84 |
Weekly price and volumes for Bok Financial
| Date |
Closing |
Open |
Range |
Volume |
Thu 04 December 2025 |
116.48 (3.43%) |
112.40 |
111.54 - 118.03 |
0.7096 times |
Fri 28 November 2025 |
112.62 (2.81%) |
109.52 |
108.69 - 114.76 |
0.7182 times |
Fri 21 November 2025 |
109.54 (1.84%) |
106.89 |
102.72 - 110.82 |
1.1896 times |
Fri 14 November 2025 |
107.56 (-0.47%) |
108.90 |
106.00 - 110.95 |
0.8817 times |
Fri 07 November 2025 |
108.07 (3.34%) |
104.56 |
103.95 - 109.56 |
2.2653 times |
Fri 31 October 2025 |
104.58 (0%) |
104.12 |
102.99 - 105.32 |
0.1698 times |
Fri 31 October 2025 |
104.58 (-1.6%) |
107.26 |
102.99 - 109.18 |
1.0324 times |
Fri 24 October 2025 |
106.28 (-1.37%) |
108.87 |
104.01 - 110.65 |
1.2916 times |
Fri 17 October 2025 |
107.76 (-0.65%) |
110.46 |
103.87 - 114.32 |
0.9267 times |
Fri 10 October 2025 |
108.46 (-4.31%) |
114.00 |
108.44 - 117.42 |
0.815 times |
Fri 03 October 2025 |
113.34 (0.44%) |
113.19 |
106.30 - 114.06 |
0.6419 times |
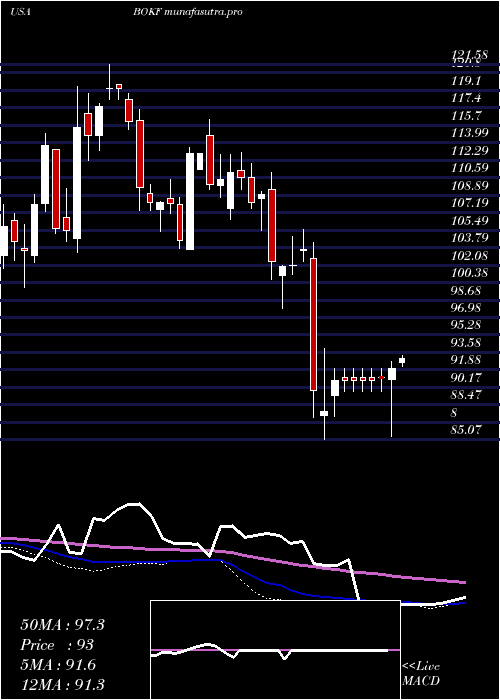
Monthly price and charts BokFinancial Strong monthly Stock price targets for BokFinancial BOKF are 114.01 and 120.5 | Monthly Target 1 | 108.86 | | Monthly Target 2 | 112.67 | | Monthly Target 3 | 115.35 | | Monthly Target 4 | 119.16 | | Monthly Target 5 | 121.84 |
Monthly price and volumes Bok Financial
| Date |
Closing |
Open |
Range |
Volume |
Thu 04 December 2025 |
116.48 (3.43%) |
112.40 |
111.54 - 118.03 |
0.2109 times |
Fri 28 November 2025 |
112.62 (7.69%) |
104.56 |
102.72 - 114.76 |
1.502 times |
Fri 31 October 2025 |
104.58 (-6.16%) |
111.20 |
102.99 - 117.42 |
1.3798 times |
Tue 30 September 2025 |
111.44 (0.03%) |
110.59 |
107.92 - 114.17 |
1.0137 times |
Fri 29 August 2025 |
111.41 (9.73%) |
100.22 |
97.40 - 112.97 |
0.8633 times |
Thu 31 July 2025 |
101.53 (3.99%) |
97.16 |
96.89 - 107.74 |
1.3334 times |
Mon 30 June 2025 |
97.63 (3.4%) |
94.44 |
91.35 - 98.52 |
0.9678 times |
Fri 30 May 2025 |
94.42 (1.34%) |
92.77 |
91.40 - 100.00 |
0.9243 times |
Wed 30 April 2025 |
93.17 (-10.54%) |
103.28 |
85.07 - 104.15 |
1.2166 times |
Mon 31 March 2025 |
104.15 (-4.41%) |
109.45 |
97.84 - 111.12 |
0.5883 times |
Fri 28 February 2025 |
108.96 (-1.32%) |
107.63 |
105.49 - 113.03 |
0.5173 times |

DMA SMA EMA moving averages of Bok Financial BOKF
DMA (daily moving average) of Bok Financial BOKF
| DMA period | DMA value | | 5 day DMA | 115.04 | | 12 day DMA | 111.54 | | 20 day DMA | 109.92 | | 35 day DMA | 108.28 | | 50 day DMA | 109.53 | | 100 day DMA | 108.5 | | 150 day DMA | 104.6 | | 200 day DMA | 102.94 | EMA (exponential moving average) of Bok Financial BOKF
| EMA period | EMA current | EMA prev | EMA prev2 | | 5 day EMA | 115.1 | 114.41 | 113.35 | | 12 day EMA | 112.63 | 111.93 | 111.09 | | 20 day EMA | 111.14 | 110.58 | 109.95 | | 35 day EMA | 110.53 | 110.18 | 109.81 | | 50 day EMA | 110.27 | 110.02 | 109.75 |
SMA (simple moving average) of Bok Financial BOKF
| SMA period | SMA current | SMA prev | SMA prev2 | | 5 day SMA | 115.04 | 114.45 | 113.81 | | 12 day SMA | 111.54 | 110.43 | 109.68 | | 20 day SMA | 109.92 | 109.45 | 108.84 | | 35 day SMA | 108.28 | 108.11 | 108.02 | | 50 day SMA | 109.53 | 109.45 | 109.33 | | 100 day SMA | 108.5 | 108.35 | 108.23 | | 150 day SMA | 104.6 | 104.44 | 104.29 | | 200 day SMA | 102.94 | 102.91 | 102.89 |
|
|
