BankNova BNS full analysis,charts,indicators,moving averages,SMA,DMA,EMA,ADX,MACD,RSIBank Nova BNS WideScreen charts, DMA,SMA,EMA technical analysis, forecast prediction, by indicators ADX,MACD,RSI,CCI USA stock exchange
operates under Finance sector & deals in Major Banks
Daily price and charts and targets BankNova Strong Daily Stock price targets for BankNova BNS are 63.9 and 64.33 | Daily Target 1 | 63.56 | | Daily Target 2 | 63.81 | | Daily Target 3 | 63.99 | | Daily Target 4 | 64.24 | | Daily Target 5 | 64.42 |
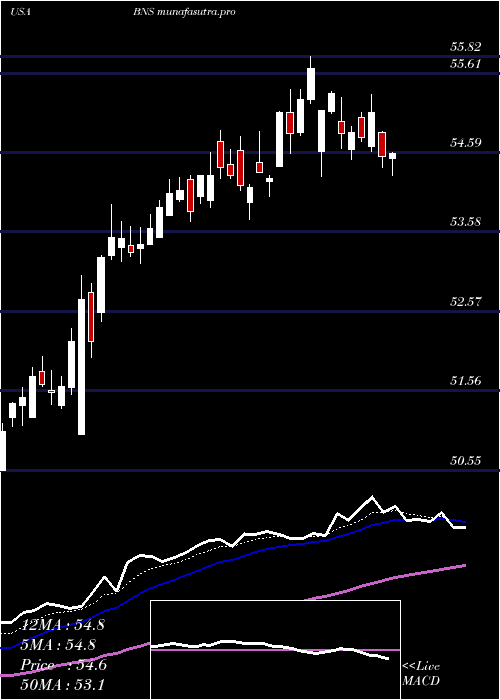
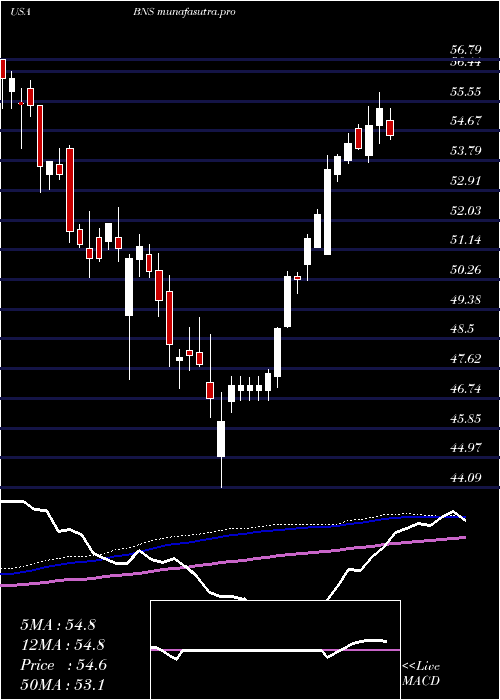
Daily price and volume Bank Nova
| Date |
Closing |
Open |
Range |
Volume |
Mon 20 October 2025 |
64.06 (0.49%) |
63.89 |
63.74 - 64.17 |
0.5853 times |
Fri 17 October 2025 |
63.75 (-0.36%) |
64.14 |
63.68 - 64.14 |
0.9505 times |
Thu 16 October 2025 |
63.98 (-0.82%) |
64.54 |
63.87 - 64.77 |
1.1553 times |
Wed 15 October 2025 |
64.51 (0.58%) |
64.35 |
64.19 - 64.64 |
0.9652 times |
Tue 14 October 2025 |
64.14 (0.39%) |
63.20 |
62.98 - 64.21 |
1.0224 times |
Mon 13 October 2025 |
63.89 (0.73%) |
63.78 |
63.70 - 64.10 |
0.6172 times |
Fri 10 October 2025 |
63.43 (-0.19%) |
63.85 |
63.39 - 64.17 |
1.3203 times |
Thu 09 October 2025 |
63.55 (0.38%) |
63.35 |
63.34 - 63.68 |
1.2131 times |
Wed 08 October 2025 |
63.31 (-1.36%) |
64.38 |
63.21 - 64.38 |
1.1476 times |
Tue 07 October 2025 |
64.18 (-1.81%) |
64.52 |
64.10 - 64.59 |
1.023 times |
Mon 06 October 2025 |
65.36 (0.17%) |
65.30 |
64.61 - 65.44 |
1.205 times |
Weekly price and charts BankNova Strong weekly Stock price targets for BankNova BNS are 63.9 and 64.33 | Weekly Target 1 | 63.56 | | Weekly Target 2 | 63.81 | | Weekly Target 3 | 63.99 | | Weekly Target 4 | 64.24 | | Weekly Target 5 | 64.42 |
Weekly price and volumes for Bank Nova
| Date |
Closing |
Open |
Range |
Volume |
Mon 20 October 2025 |
64.06 (0.49%) |
63.89 |
63.74 - 64.17 |
0.1156 times |
Fri 17 October 2025 |
63.75 (0.5%) |
63.78 |
62.98 - 64.77 |
0.9306 times |
Fri 10 October 2025 |
63.43 (-2.79%) |
65.30 |
63.21 - 65.44 |
1.1674 times |
Fri 03 October 2025 |
65.25 (1.34%) |
64.11 |
63.92 - 65.52 |
1.0149 times |
Fri 26 September 2025 |
64.39 (-0.83%) |
64.88 |
63.81 - 64.96 |
1.2595 times |
Fri 19 September 2025 |
64.93 (2.45%) |
63.39 |
63.20 - 65.19 |
1.0376 times |
Fri 12 September 2025 |
63.38 (-0.09%) |
63.48 |
63.19 - 64.38 |
1.1213 times |
Fri 05 September 2025 |
63.44 (1.57%) |
61.94 |
61.69 - 64.04 |
1.1172 times |
Fri 29 August 2025 |
62.46 (0%) |
62.01 |
61.99 - 62.69 |
0.2785 times |
Fri 29 August 2025 |
62.46 (8.38%) |
57.55 |
57.23 - 62.69 |
1.9574 times |
Fri 22 August 2025 |
57.63 (1.48%) |
56.71 |
56.54 - 57.70 |
1.0066 times |
Monthly price and charts BankNova Strong monthly Stock price targets for BankNova BNS are 62.25 and 64.79 | Monthly Target 1 | 61.65 | | Monthly Target 2 | 62.85 | | Monthly Target 3 | 64.186666666667 | | Monthly Target 4 | 65.39 | | Monthly Target 5 | 66.73 |
Monthly price and volumes Bank Nova
| Date |
Closing |
Open |
Range |
Volume |
Mon 20 October 2025 |
64.06 (-0.91%) |
64.73 |
62.98 - 65.52 |
0.5568 times |
Tue 30 September 2025 |
64.65 (3.51%) |
61.94 |
61.69 - 65.19 |
0.9813 times |
Fri 29 August 2025 |
62.46 (12.32%) |
55.38 |
55.21 - 62.69 |
0.9889 times |
Thu 31 July 2025 |
55.61 (0.62%) |
55.27 |
54.29 - 56.98 |
1.2765 times |
Mon 30 June 2025 |
55.27 (3.27%) |
53.39 |
53.18 - 55.40 |
1.0351 times |
Fri 30 May 2025 |
53.52 (7.08%) |
49.95 |
49.56 - 53.93 |
0.8887 times |
Wed 30 April 2025 |
49.98 (5.38%) |
46.60 |
44.09 - 50.09 |
1.1767 times |
Mon 31 March 2025 |
47.43 (-4.43%) |
49.91 |
46.59 - 50.39 |
1.0707 times |
Fri 28 February 2025 |
49.63 (-3.01%) |
49.19 |
47.29 - 51.60 |
0.8103 times |
Fri 31 January 2025 |
51.17 (-4.75%) |
53.74 |
50.32 - 54.25 |
1.2151 times |
Tue 31 December 2024 |
53.72 (-4.45%) |
55.50 |
52.86 - 56.16 |
0.3558 times |
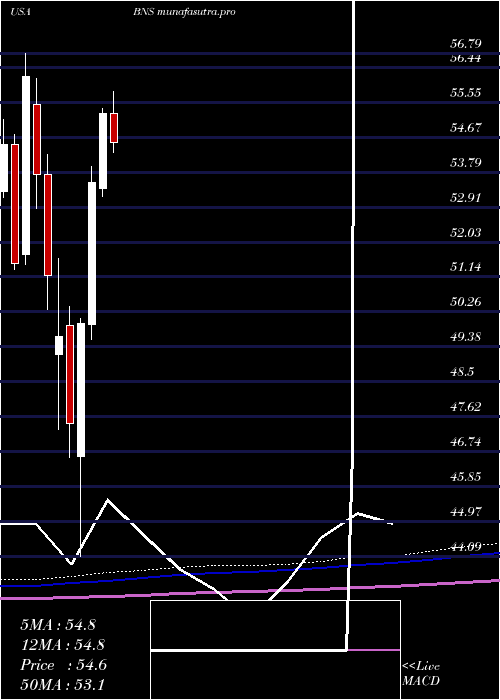
DMA SMA EMA moving averages of Bank Nova BNS
DMA (daily moving average) of Bank Nova BNS
| DMA period | DMA value | | 5 day DMA | 64.09 | | 12 day DMA | 64.12 | | 20 day DMA | 64.28 | | 35 day DMA | 64.12 | | 50 day DMA | 62.46 | | 100 day DMA | 58.66 | | 150 day DMA | 55.36 | | 200 day DMA | 54.14 | EMA (exponential moving average) of Bank Nova BNS
| EMA period | EMA current | EMA prev | EMA prev2 | | 5 day EMA | 64.01 | 63.98 | 64.09 | | 12 day EMA | 64.08 | 64.08 | 64.14 | | 20 day EMA | 63.98 | 63.97 | 63.99 | | 35 day EMA | 63.01 | 62.95 | 62.9 | | 50 day EMA | 62.07 | 61.99 | 61.92 |
SMA (simple moving average) of Bank Nova BNS
| SMA period | SMA current | SMA prev | SMA prev2 | | 5 day SMA | 64.09 | 64.05 | 63.99 | | 12 day SMA | 64.12 | 64.2 | 64.27 | | 20 day SMA | 64.28 | 64.3 | 64.36 | | 35 day SMA | 64.12 | 64.08 | 64.04 | | 50 day SMA | 62.46 | 62.3 | 62.15 | | 100 day SMA | 58.66 | 58.55 | 58.44 | | 150 day SMA | 55.36 | 55.26 | 55.15 | | 200 day SMA | 54.14 | 54.09 | 54.04 |
|
|
