VanguardTotal BNDW full analysis,charts,indicators,moving averages,SMA,DMA,EMA,ADX,MACD,RSIVanguard Total BNDW WideScreen charts, DMA,SMA,EMA technical analysis, forecast prediction, by indicators ADX,MACD,RSI,CCI USA stock exchange
operates under N A sector & deals in N A
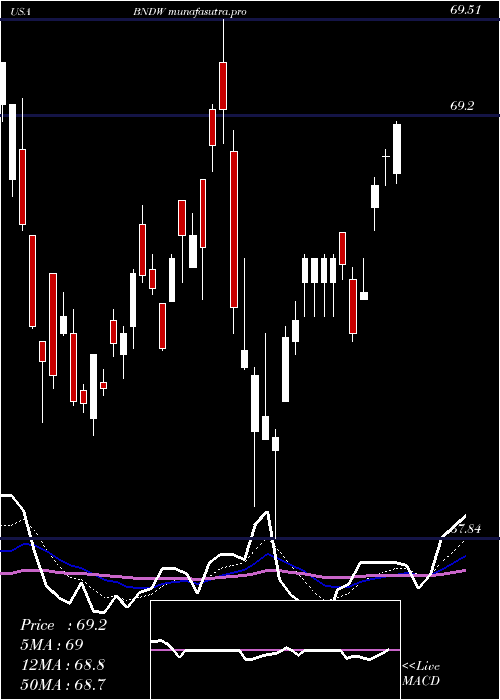
Daily price and charts and targets VanguardTotal Strong Daily Stock price targets for VanguardTotal BNDW are 70.28 and 70.36 | Daily Target 1 | 70.22 | | Daily Target 2 | 70.26 | | Daily Target 3 | 70.303333333333 | | Daily Target 4 | 70.34 | | Daily Target 5 | 70.38 |
Daily price and volume Vanguard Total
| Date |
Closing |
Open |
Range |
Volume |
Tue 21 October 2025 |
70.29 (0.09%) |
70.28 |
70.27 - 70.35 |
1.3287 times |
Mon 20 October 2025 |
70.23 (0.09%) |
70.21 |
70.17 - 70.23 |
1.2336 times |
Fri 17 October 2025 |
70.17 (-0.11%) |
70.20 |
70.11 - 70.21 |
0.9514 times |
Thu 16 October 2025 |
70.25 (0.27%) |
70.04 |
70.02 - 70.26 |
1.6164 times |
Wed 15 October 2025 |
70.06 (0.03%) |
70.08 |
70.02 - 70.14 |
0.8279 times |
Tue 14 October 2025 |
70.04 (0.13%) |
69.93 |
69.91 - 70.06 |
0.7448 times |
Mon 13 October 2025 |
69.95 (0.14%) |
69.84 |
69.81 - 69.95 |
0.7382 times |
Fri 10 October 2025 |
69.85 (0.4%) |
69.74 |
69.70 - 69.87 |
0.7349 times |
Thu 09 October 2025 |
69.57 (-0.07%) |
69.60 |
69.54 - 69.60 |
0.9208 times |
Wed 08 October 2025 |
69.62 (0.1%) |
69.72 |
69.61 - 69.72 |
0.9033 times |
Tue 07 October 2025 |
69.55 (0.14%) |
69.51 |
69.48 - 69.60 |
0.7076 times |
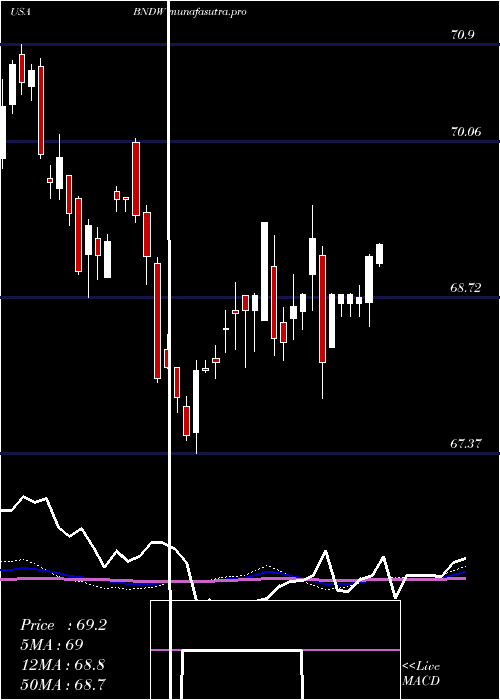
Weekly price and charts VanguardTotal Strong weekly Stock price targets for VanguardTotal BNDW are 70.23 and 70.41 | Weekly Target 1 | 70.09 | | Weekly Target 2 | 70.19 | | Weekly Target 3 | 70.27 | | Weekly Target 4 | 70.37 | | Weekly Target 5 | 70.45 |
Weekly price and volumes for Vanguard Total
| Date |
Closing |
Open |
Range |
Volume |
Tue 21 October 2025 |
70.29 (0.17%) |
70.21 |
70.17 - 70.35 |
0.6486 times |
Fri 17 October 2025 |
70.17 (0.46%) |
69.84 |
69.81 - 70.26 |
1.235 times |
Fri 10 October 2025 |
69.85 (0.33%) |
69.47 |
69.43 - 69.87 |
1.2372 times |
Fri 03 October 2025 |
69.62 (0.1%) |
69.59 |
69.53 - 69.78 |
1.2013 times |
Fri 26 September 2025 |
69.55 (-0.14%) |
69.60 |
69.42 - 69.66 |
1.0224 times |
Fri 19 September 2025 |
69.65 (-0.11%) |
69.75 |
69.55 - 69.99 |
1.2635 times |
Fri 12 September 2025 |
69.73 (0.23%) |
69.69 |
69.58 - 69.90 |
1.2676 times |
Fri 05 September 2025 |
69.57 (0.4%) |
68.90 |
68.83 - 69.63 |
1.0345 times |
Fri 29 August 2025 |
69.29 (0%) |
69.32 |
69.26 - 69.32 |
0.157 times |
Fri 29 August 2025 |
69.29 (0.06%) |
69.13 |
69.08 - 69.37 |
0.9329 times |
Fri 22 August 2025 |
69.25 (0.36%) |
69.06 |
68.94 - 69.30 |
1.4193 times |
Monthly price and charts VanguardTotal Strong monthly Stock price targets for VanguardTotal BNDW are 69.86 and 70.78 | Monthly Target 1 | 69.1 | | Monthly Target 2 | 69.7 | | Monthly Target 3 | 70.023333333333 | | Monthly Target 4 | 70.62 | | Monthly Target 5 | 70.94 |
Monthly price and volumes Vanguard Total
| Date |
Closing |
Open |
Range |
Volume |
Tue 21 October 2025 |
70.29 (0.9%) |
69.62 |
69.43 - 70.35 |
0.6921 times |
Tue 30 September 2025 |
69.66 (0.53%) |
68.90 |
68.83 - 69.99 |
0.9078 times |
Fri 29 August 2025 |
69.29 (0.35%) |
69.12 |
68.94 - 69.37 |
1.0075 times |
Thu 31 July 2025 |
69.05 (-0.4%) |
69.23 |
68.55 - 69.24 |
1.0668 times |
Mon 30 June 2025 |
69.33 (0.7%) |
68.58 |
68.43 - 69.36 |
0.9221 times |
Fri 30 May 2025 |
68.85 (-0.69%) |
69.22 |
67.96 - 69.22 |
1.1204 times |
Wed 30 April 2025 |
69.33 (0.76%) |
68.71 |
67.84 - 69.51 |
1.3108 times |
Mon 31 March 2025 |
68.81 (-0.81%) |
68.99 |
68.17 - 69.25 |
0.5986 times |
Fri 28 February 2025 |
69.37 (1.34%) |
68.60 |
68.11 - 69.37 |
0.5857 times |
Fri 31 January 2025 |
68.45 (0.38%) |
68.27 |
67.37 - 68.61 |
1.7883 times |
Tue 31 December 2024 |
68.19 (-1.97%) |
70.05 |
67.98 - 70.09 |
1.7765 times |

DMA SMA EMA moving averages of Vanguard Total BNDW
DMA (daily moving average) of Vanguard Total BNDW
| DMA period | DMA value | | 5 day DMA | 70.2 | | 12 day DMA | 69.92 | | 20 day DMA | 69.79 | | 35 day DMA | 69.73 | | 50 day DMA | 69.56 | | 100 day DMA | 69.24 | | 150 day DMA | 69.04 | | 200 day DMA | 68.88 | EMA (exponential moving average) of Vanguard Total BNDW
| EMA period | EMA current | EMA prev | EMA prev2 | | 5 day EMA | 70.18 | 70.13 | 70.08 | | 12 day EMA | 70.01 | 69.96 | 69.91 | | 20 day EMA | 69.88 | 69.84 | 69.8 | | 35 day EMA | 69.72 | 69.69 | 69.66 | | 50 day EMA | 69.6 | 69.57 | 69.54 |
SMA (simple moving average) of Vanguard Total BNDW
| SMA period | SMA current | SMA prev | SMA prev2 | | 5 day SMA | 70.2 | 70.15 | 70.09 | | 12 day SMA | 69.92 | 69.86 | 69.82 | | 20 day SMA | 69.79 | 69.76 | 69.73 | | 35 day SMA | 69.73 | 69.69 | 69.66 | | 50 day SMA | 69.56 | 69.54 | 69.51 | | 100 day SMA | 69.24 | 69.23 | 69.21 | | 150 day SMA | 69.04 | 69.03 | 69.02 | | 200 day SMA | 68.88 | 68.87 | 68.86 |
|
|
