VanguardTotal BND full analysis,charts,indicators,moving averages,SMA,DMA,EMA,ADX,MACD,RSIVanguard Total BND WideScreen charts, DMA,SMA,EMA technical analysis, forecast prediction, by indicators ADX,MACD,RSI,CCI USA stock exchange
operates under N A sector & deals in N A
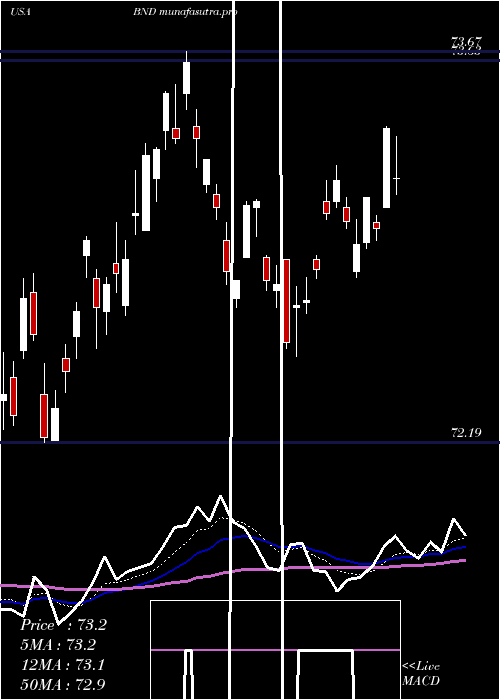
Daily price and charts and targets VanguardTotal Strong Daily Stock price targets for VanguardTotal BND are 74.22 and 74.33 | Daily Target 1 | 74.2 | | Daily Target 2 | 74.24 | | Daily Target 3 | 74.306666666667 | | Daily Target 4 | 74.35 | | Daily Target 5 | 74.42 |
Daily price and volume Vanguard Total
| Date |
Closing |
Open |
Range |
Volume |
Thu 04 December 2025 |
74.29 (-0.19%) |
74.36 |
74.26 - 74.37 |
1.0428 times |
Wed 03 December 2025 |
74.43 (0.15%) |
74.41 |
74.34 - 74.47 |
1.389 times |
Tue 02 December 2025 |
74.32 (0.09%) |
74.50 |
74.20 - 74.50 |
0.9136 times |
Mon 01 December 2025 |
74.25 (-0.71%) |
74.27 |
74.21 - 74.30 |
0.9793 times |
Fri 28 November 2025 |
74.78 (-0.16%) |
74.86 |
74.71 - 74.88 |
0.6838 times |
Wed 26 November 2025 |
74.90 (0.11%) |
74.78 |
74.68 - 74.90 |
1.0412 times |
Tue 25 November 2025 |
74.82 (0.23%) |
74.74 |
74.67 - 74.89 |
0.9644 times |
Mon 24 November 2025 |
74.65 (0.17%) |
74.62 |
74.55 - 74.68 |
0.8149 times |
Fri 21 November 2025 |
74.52 (0.24%) |
74.55 |
74.40 - 74.55 |
0.9687 times |
Thu 20 November 2025 |
74.34 (0.15%) |
74.31 |
74.29 - 74.40 |
1.2024 times |
Wed 19 November 2025 |
74.23 (-0.04%) |
74.34 |
74.20 - 74.37 |
1.0697 times |
Weekly price and charts VanguardTotal Strong weekly Stock price targets for VanguardTotal BND are 74.25 and 74.55 | Weekly Target 1 | 74.03 | | Weekly Target 2 | 74.16 | | Weekly Target 3 | 74.33 | | Weekly Target 4 | 74.46 | | Weekly Target 5 | 74.63 |
Weekly price and volumes for Vanguard Total
| Date |
Closing |
Open |
Range |
Volume |
Thu 04 December 2025 |
74.29 (-0.66%) |
74.27 |
74.20 - 74.50 |
0.9529 times |
Fri 28 November 2025 |
74.78 (0.35%) |
74.62 |
74.55 - 74.90 |
0.7721 times |
Fri 21 November 2025 |
74.52 (0.49%) |
74.21 |
74.18 - 74.55 |
1.1812 times |
Fri 14 November 2025 |
74.16 (-0.23%) |
74.32 |
74.16 - 74.59 |
0.9986 times |
Fri 07 November 2025 |
74.33 (-0.34%) |
74.26 |
74.04 - 74.53 |
1.0295 times |
Fri 31 October 2025 |
74.58 (0%) |
74.66 |
74.54 - 74.68 |
0.2225 times |
Fri 31 October 2025 |
74.58 (-0.59%) |
74.96 |
74.50 - 75.12 |
1.198 times |
Fri 24 October 2025 |
75.02 (0.19%) |
74.88 |
74.84 - 75.15 |
0.9999 times |
Fri 17 October 2025 |
74.88 (0.48%) |
74.54 |
74.45 - 75.00 |
1.4402 times |
Fri 10 October 2025 |
74.52 (0.11%) |
74.17 |
74.13 - 74.58 |
1.2052 times |
Fri 03 October 2025 |
74.44 (0.31%) |
74.31 |
74.21 - 74.55 |
1.1941 times |

Monthly price and charts VanguardTotal Strong monthly Stock price targets for VanguardTotal BND are 74.25 and 74.55 | Monthly Target 1 | 74.03 | | Monthly Target 2 | 74.16 | | Monthly Target 3 | 74.33 | | Monthly Target 4 | 74.46 | | Monthly Target 5 | 74.63 |
Monthly price and volumes Vanguard Total
| Date |
Closing |
Open |
Range |
Volume |
Thu 04 December 2025 |
74.29 (-0.66%) |
74.27 |
74.20 - 74.50 |
0.2326 times |
Fri 28 November 2025 |
74.78 (0.27%) |
74.26 |
74.04 - 74.90 |
0.9717 times |
Fri 31 October 2025 |
74.58 (0.28%) |
74.32 |
74.13 - 75.15 |
1.418 times |
Tue 30 September 2025 |
74.37 (0.77%) |
73.34 |
73.31 - 74.92 |
1.0762 times |
Fri 29 August 2025 |
73.80 (0.82%) |
73.50 |
73.29 - 73.92 |
1.0297 times |
Thu 31 July 2025 |
73.20 (-0.58%) |
73.39 |
72.52 - 73.45 |
1.0339 times |
Mon 30 June 2025 |
73.63 (1.18%) |
72.35 |
72.19 - 73.67 |
1.051 times |
Fri 30 May 2025 |
72.77 (-0.99%) |
73.34 |
71.76 - 73.37 |
0.9633 times |
Wed 30 April 2025 |
73.50 (0.07%) |
73.22 |
71.41 - 74.34 |
1.3878 times |
Mon 31 March 2025 |
73.45 (-0.29%) |
73.25 |
72.77 - 73.75 |
0.8357 times |
Fri 28 February 2025 |
73.66 (1.82%) |
72.23 |
71.75 - 73.69 |
0.9767 times |

DMA SMA EMA moving averages of Vanguard Total BND
DMA (daily moving average) of Vanguard Total BND
| DMA period | DMA value | | 5 day DMA | 74.41 | | 12 day DMA | 74.48 | | 20 day DMA | 74.42 | | 35 day DMA | 74.58 | | 50 day DMA | 74.52 | | 100 day DMA | 74.12 | | 150 day DMA | 73.65 | | 200 day DMA | 73.49 | EMA (exponential moving average) of Vanguard Total BND
| EMA period | EMA current | EMA prev | EMA prev2 | | 5 day EMA | 74.4 | 74.46 | 74.48 | | 12 day EMA | 74.46 | 74.49 | 74.5 | | 20 day EMA | 74.46 | 74.48 | 74.49 | | 35 day EMA | 74.48 | 74.49 | 74.49 | | 50 day EMA | 74.5 | 74.51 | 74.51 |
SMA (simple moving average) of Vanguard Total BND
| SMA period | SMA current | SMA prev | SMA prev2 | | 5 day SMA | 74.41 | 74.54 | 74.61 | | 12 day SMA | 74.48 | 74.48 | 74.45 | | 20 day SMA | 74.42 | 74.41 | 74.4 | | 35 day SMA | 74.58 | 74.59 | 74.6 | | 50 day SMA | 74.52 | 74.52 | 74.52 | | 100 day SMA | 74.12 | 74.1 | 74.09 | | 150 day SMA | 73.65 | 73.64 | 73.64 | | 200 day SMA | 73.49 | 73.48 | 73.47 |
|
|
