BristolMyers BMY full analysis,charts,indicators,moving averages,SMA,DMA,EMA,ADX,MACD,RSIBristol Myers BMY WideScreen charts, DMA,SMA,EMA technical analysis, forecast prediction, by indicators ADX,MACD,RSI,CCI USA stock exchange
operates under Health Care sector & deals in Major Pharmaceuticals
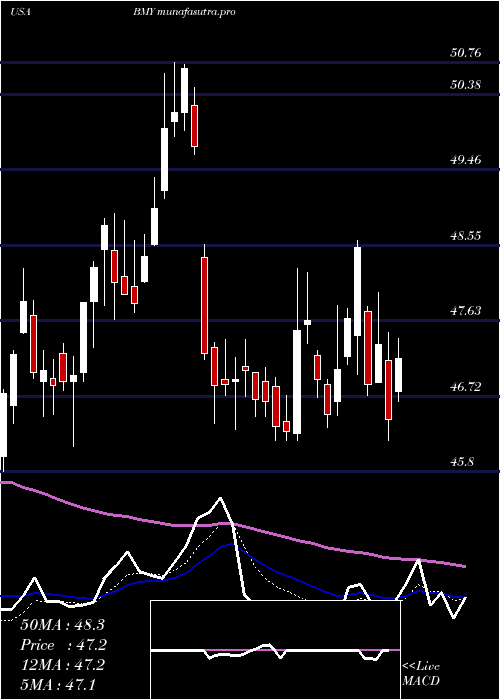
Daily price and charts and targets BristolMyers Strong Daily Stock price targets for BristolMyers BMY are 51.11 and 52.96 | Daily Target 1 | 49.58 | | Daily Target 2 | 50.79 | | Daily Target 3 | 51.433333333333 | | Daily Target 4 | 52.64 | | Daily Target 5 | 53.28 |
Daily price and volume Bristol Myers
| Date |
Closing |
Open |
Range |
Volume |
Thu 04 December 2025 |
51.99 (2.02%) |
51.12 |
50.23 - 52.08 |
0.9518 times |
Wed 03 December 2025 |
50.96 (5.59%) |
49.94 |
49.43 - 51.34 |
2.1188 times |
Tue 02 December 2025 |
48.26 (-1.87%) |
49.13 |
48.22 - 49.20 |
0.6049 times |
Mon 01 December 2025 |
49.18 (-0.04%) |
49.23 |
48.76 - 49.86 |
0.9197 times |
Fri 28 November 2025 |
49.20 (-0.1%) |
49.23 |
49.01 - 49.37 |
0.4834 times |
Wed 26 November 2025 |
49.25 (0.41%) |
49.27 |
48.80 - 49.50 |
0.4813 times |
Tue 25 November 2025 |
49.05 (2.68%) |
48.21 |
48.10 - 49.40 |
1.1719 times |
Mon 24 November 2025 |
47.77 (3.29%) |
46.86 |
46.43 - 48.63 |
1.212 times |
Fri 21 November 2025 |
46.25 (0.67%) |
46.17 |
45.52 - 46.99 |
1.108 times |
Thu 20 November 2025 |
45.94 (0.33%) |
45.90 |
45.27 - 46.20 |
0.9483 times |
Wed 19 November 2025 |
45.79 (-2.7%) |
47.00 |
45.74 - 47.00 |
1.1582 times |
Weekly price and charts BristolMyers Strong weekly Stock price targets for BristolMyers BMY are 50.11 and 53.97 | Weekly Target 1 | 46.9 | | Weekly Target 2 | 49.45 | | Weekly Target 3 | 50.763333333333 | | Weekly Target 4 | 53.31 | | Weekly Target 5 | 54.62 |
Weekly price and volumes for Bristol Myers
| Date |
Closing |
Open |
Range |
Volume |
Thu 04 December 2025 |
51.99 (5.67%) |
49.23 |
48.22 - 52.08 |
0.9877 times |
Fri 28 November 2025 |
49.20 (6.38%) |
46.86 |
46.43 - 49.50 |
0.7198 times |
Fri 21 November 2025 |
46.25 (-0.86%) |
46.52 |
45.27 - 47.73 |
1.1518 times |
Fri 14 November 2025 |
46.65 (-0.13%) |
46.67 |
46.12 - 49.99 |
1.0535 times |
Fri 07 November 2025 |
46.71 (1.39%) |
45.93 |
45.38 - 47.00 |
0.5946 times |
Fri 31 October 2025 |
46.07 (0%) |
45.47 |
45.20 - 46.50 |
0.3608 times |
Fri 31 October 2025 |
46.07 (5.09%) |
43.82 |
42.52 - 46.50 |
1.9967 times |
Fri 24 October 2025 |
43.84 (0.5%) |
43.77 |
43.34 - 45.23 |
0.8659 times |
Fri 17 October 2025 |
43.62 (-0.77%) |
43.68 |
43.11 - 44.24 |
1.1393 times |
Fri 10 October 2025 |
43.96 (-3.3%) |
45.45 |
43.77 - 45.91 |
1.1299 times |
Fri 03 October 2025 |
45.46 (3.04%) |
44.00 |
43.79 - 48.58 |
2.2265 times |
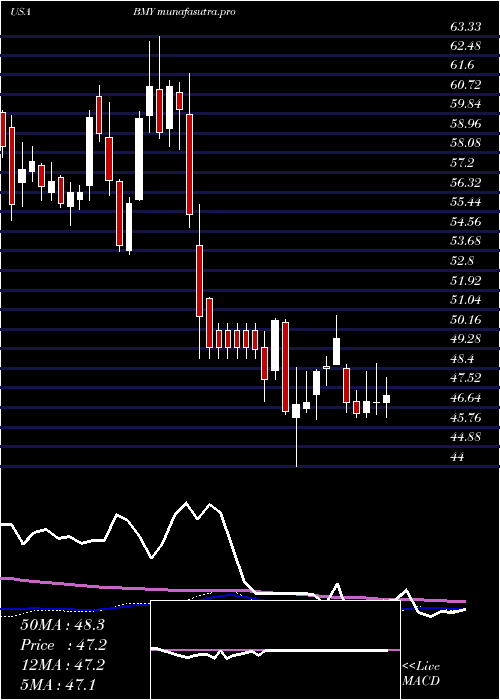
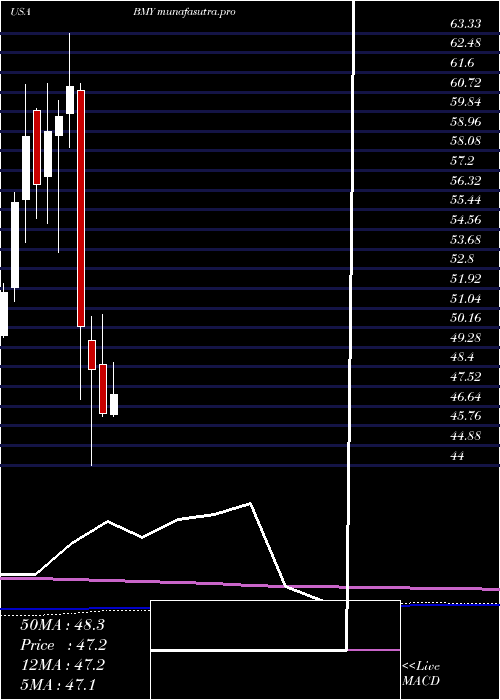
Monthly price and charts BristolMyers Strong monthly Stock price targets for BristolMyers BMY are 50.11 and 53.97 | Monthly Target 1 | 46.9 | | Monthly Target 2 | 49.45 | | Monthly Target 3 | 50.763333333333 | | Monthly Target 4 | 53.31 | | Monthly Target 5 | 54.62 |
Monthly price and volumes Bristol Myers
| Date |
Closing |
Open |
Range |
Volume |
Thu 04 December 2025 |
51.99 (5.67%) |
49.23 |
48.22 - 52.08 |
0.2219 times |
Fri 28 November 2025 |
49.20 (6.79%) |
45.93 |
45.27 - 49.99 |
0.7908 times |
Fri 31 October 2025 |
46.07 (2.15%) |
46.00 |
42.52 - 48.58 |
1.5206 times |
Tue 30 September 2025 |
45.10 (-4.41%) |
47.30 |
43.19 - 48.51 |
1.1529 times |
Fri 29 August 2025 |
47.18 (8.94%) |
43.61 |
43.57 - 49.58 |
0.8354 times |
Thu 31 July 2025 |
43.31 (-6.44%) |
46.26 |
42.96 - 49.28 |
1.1097 times |
Mon 30 June 2025 |
46.29 (-4.12%) |
48.50 |
46.17 - 50.76 |
1.0038 times |
Fri 30 May 2025 |
48.28 (-3.82%) |
49.57 |
44.00 - 50.65 |
1.2512 times |
Wed 30 April 2025 |
50.20 (-17.69%) |
60.77 |
46.93 - 61.10 |
1.1884 times |
Mon 31 March 2025 |
60.99 (2.3%) |
59.75 |
58.23 - 63.33 |
0.9253 times |
Fri 28 February 2025 |
59.62 (1.14%) |
58.79 |
53.54 - 60.36 |
0.9106 times |
DMA SMA EMA moving averages of Bristol Myers BMY
DMA (daily moving average) of Bristol Myers BMY
| DMA period | DMA value | | 5 day DMA | 49.92 | | 12 day DMA | 48.39 | | 20 day DMA | 48.06 | | 35 day DMA | 46.48 | | 50 day DMA | 45.93 | | 100 day DMA | 46.38 | | 150 day DMA | 46.79 | | 200 day DMA | 48.99 | EMA (exponential moving average) of Bristol Myers BMY
| EMA period | EMA current | EMA prev | EMA prev2 | | 5 day EMA | 50.24 | 49.37 | 48.57 | | 12 day EMA | 48.99 | 48.44 | 47.98 | | 20 day EMA | 48.16 | 47.76 | 47.42 | | 35 day EMA | 47.18 | 46.9 | 46.66 | | 50 day EMA | 46.25 | 46.02 | 45.82 |
SMA (simple moving average) of Bristol Myers BMY
| SMA period | SMA current | SMA prev | SMA prev2 | | 5 day SMA | 49.92 | 49.37 | 48.99 | | 12 day SMA | 48.39 | 47.96 | 47.6 | | 20 day SMA | 48.06 | 47.78 | 47.52 | | 35 day SMA | 46.48 | 46.25 | 46.04 | | 50 day SMA | 45.93 | 45.78 | 45.65 | | 100 day SMA | 46.38 | 46.33 | 46.29 | | 150 day SMA | 46.79 | 46.78 | 46.76 | | 200 day SMA | 48.99 | 49.01 | 49.03 |
|
|
