BankMontreal BMO full analysis,charts,indicators,moving averages,SMA,DMA,EMA,ADX,MACD,RSIBank Montreal BMO WideScreen charts, DMA,SMA,EMA technical analysis, forecast prediction, by indicators ADX,MACD,RSI,CCI USA stock exchange
operates under Finance sector & deals in Commercial Banks
Daily price and charts and targets BankMontreal Strong Daily Stock price targets for BankMontreal BMO are 125.51 and 126.44 | Daily Target 1 | 124.79 | | Daily Target 2 | 125.3 | | Daily Target 3 | 125.72333333333 | | Daily Target 4 | 126.23 | | Daily Target 5 | 126.65 |
Daily price and volume Bank Montreal
| Date |
Closing |
Open |
Range |
Volume |
Mon 20 October 2025 |
125.80 (0.7%) |
125.38 |
125.22 - 126.15 |
0.5969 times |
Fri 17 October 2025 |
124.92 (0.18%) |
124.89 |
124.29 - 126.03 |
1.1832 times |
Thu 16 October 2025 |
124.70 (-2.78%) |
128.93 |
123.58 - 128.93 |
2.3531 times |
Wed 15 October 2025 |
128.26 (0.39%) |
128.14 |
128.04 - 129.31 |
1.5446 times |
Tue 14 October 2025 |
127.76 (0.76%) |
125.26 |
124.84 - 127.92 |
0.6584 times |
Mon 13 October 2025 |
126.80 (-1.47%) |
126.70 |
125.42 - 126.99 |
0.5042 times |
Tue 07 October 2025 |
128.69 (-0.44%) |
129.58 |
128.46 - 130.04 |
0.6182 times |
Mon 06 October 2025 |
129.26 (0.18%) |
129.46 |
127.66 - 129.49 |
0.6879 times |
Fri 03 October 2025 |
129.03 (-1.5%) |
128.95 |
126.16 - 129.39 |
1.2409 times |
Thu 02 October 2025 |
131.00 (0.41%) |
130.73 |
129.33 - 131.00 |
0.6127 times |
Wed 01 October 2025 |
130.46 (0.16%) |
129.93 |
129.93 - 131.08 |
0.5365 times |
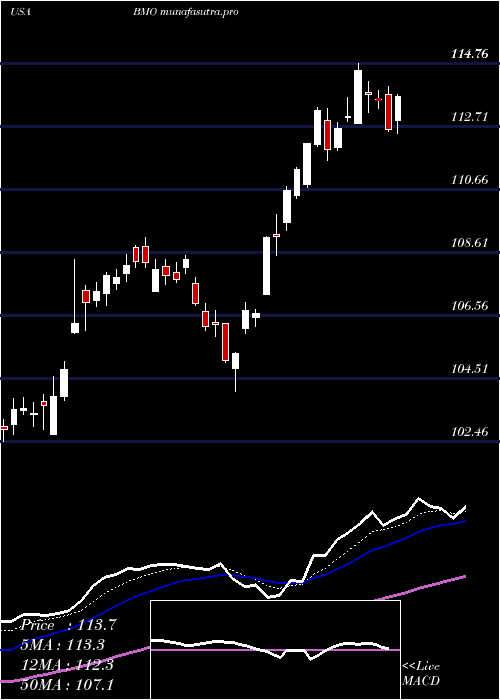
Weekly price and charts BankMontreal Strong weekly Stock price targets for BankMontreal BMO are 125.51 and 126.44 | Weekly Target 1 | 124.79 | | Weekly Target 2 | 125.3 | | Weekly Target 3 | 125.72333333333 | | Weekly Target 4 | 126.23 | | Weekly Target 5 | 126.65 |
Weekly price and volumes for Bank Montreal
| Date |
Closing |
Open |
Range |
Volume |
Mon 20 October 2025 |
125.80 (0.7%) |
125.38 |
125.22 - 126.15 |
0.1485 times |
Fri 17 October 2025 |
124.92 (-2.93%) |
126.70 |
123.58 - 129.31 |
1.5535 times |
Tue 07 October 2025 |
128.69 (-0.26%) |
129.46 |
127.66 - 130.04 |
0.325 times |
Fri 03 October 2025 |
129.03 (-1.22%) |
130.56 |
126.16 - 131.36 |
0.9772 times |
Fri 26 September 2025 |
130.63 (0.24%) |
130.11 |
127.71 - 131.00 |
1.1673 times |
Fri 19 September 2025 |
130.32 (3.17%) |
126.65 |
126.07 - 131.26 |
1.2664 times |
Fri 12 September 2025 |
126.31 (0.17%) |
126.72 |
125.88 - 127.37 |
0.9078 times |
Fri 05 September 2025 |
126.10 (4.21%) |
119.51 |
119.51 - 127.20 |
1.2775 times |
Fri 29 August 2025 |
121.00 (0%) |
118.94 |
118.66 - 121.17 |
0.341 times |
Fri 29 August 2025 |
121.00 (5.47%) |
114.45 |
113.60 - 121.17 |
2.0359 times |
Fri 22 August 2025 |
114.73 (1.12%) |
113.05 |
112.21 - 114.80 |
0.836 times |
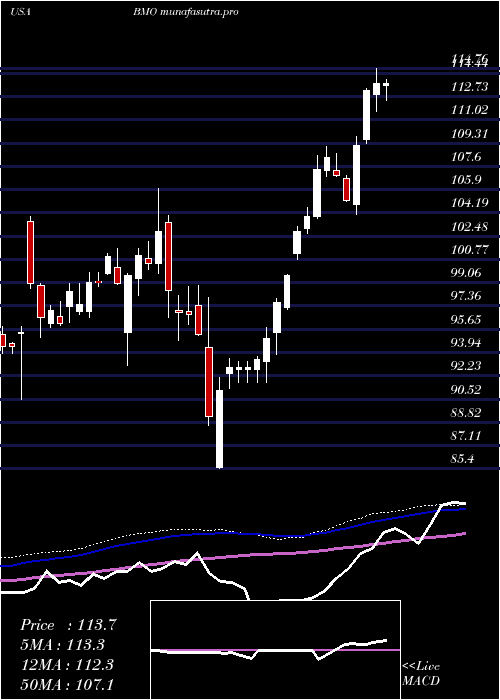
Monthly price and charts BankMontreal Strong monthly Stock price targets for BankMontreal BMO are 120.94 and 128.44 | Monthly Target 1 | 119.32 | | Monthly Target 2 | 122.56 | | Monthly Target 3 | 126.82 | | Monthly Target 4 | 130.06 | | Monthly Target 5 | 134.32 |
Monthly price and volumes Bank Montreal
| Date |
Closing |
Open |
Range |
Volume |
Mon 20 October 2025 |
125.80 (-3.42%) |
129.93 |
123.58 - 131.08 |
0.5366 times |
Tue 30 September 2025 |
130.25 (7.64%) |
119.51 |
119.51 - 131.36 |
1.0238 times |
Fri 29 August 2025 |
121.00 (9.56%) |
110.24 |
109.64 - 121.17 |
1.075 times |
Thu 31 July 2025 |
110.44 (-0.17%) |
110.45 |
109.87 - 115.66 |
1.3567 times |
Mon 30 June 2025 |
110.63 (3.06%) |
107.29 |
104.08 - 110.74 |
0.8163 times |
Fri 30 May 2025 |
107.35 (12.43%) |
95.16 |
95.04 - 108.38 |
0.9574 times |
Wed 30 April 2025 |
95.48 (-0.03%) |
95.33 |
85.40 - 97.98 |
1.3402 times |
Mon 31 March 2025 |
95.51 (-7.11%) |
103.52 |
93.41 - 103.98 |
0.91 times |
Fri 28 February 2025 |
102.82 (3.82%) |
95.40 |
92.99 - 106.00 |
1.0271 times |
Fri 31 January 2025 |
99.04 (2.05%) |
97.22 |
95.90 - 101.55 |
0.9571 times |
Tue 31 December 2024 |
97.05 (2.81%) |
95.33 |
90.47 - 103.91 |
0.6577 times |

DMA SMA EMA moving averages of Bank Montreal BMO
DMA (daily moving average) of Bank Montreal BMO
| DMA period | DMA value | | 5 day DMA | 126.29 | | 12 day DMA | 128.08 | | 20 day DMA | 128.75 | | 35 day DMA | 127.23 | | 50 day DMA | 123.3 | | 100 day DMA | 116.7 | | 150 day DMA | 109.88 | | 200 day DMA | 107.25 | EMA (exponential moving average) of Bank Montreal BMO
| EMA period | EMA current | EMA prev | EMA prev2 | | 5 day EMA | 126.17 | 126.36 | 127.08 | | 12 day EMA | 127.31 | 127.58 | 128.06 | | 20 day EMA | 127.3 | 127.46 | 127.73 | | 35 day EMA | 125.15 | 125.11 | 125.12 | | 50 day EMA | 122.61 | 122.48 | 122.38 |
SMA (simple moving average) of Bank Montreal BMO
| SMA period | SMA current | SMA prev | SMA prev2 | | 5 day SMA | 126.29 | 126.49 | 127.24 | | 12 day SMA | 128.08 | 128.41 | 128.89 | | 20 day SMA | 128.75 | 128.95 | 129.2 | | 35 day SMA | 127.23 | 127.04 | 126.88 | | 50 day SMA | 123.3 | 123.04 | 122.78 | | 100 day SMA | 116.7 | 116.48 | 116.27 | | 150 day SMA | 109.88 | 109.67 | 109.49 | | 200 day SMA | 107.25 | 107.1 | 106.96 |
|
|
