BlackbaudInc BLKB full analysis,charts,indicators,moving averages,SMA,DMA,EMA,ADX,MACD,RSIBlackbaud Inc BLKB WideScreen charts, DMA,SMA,EMA technical analysis, forecast prediction, by indicators ADX,MACD,RSI,CCI USA stock exchange
operates under Technology sector & deals in Computer Software Prepackaged Software
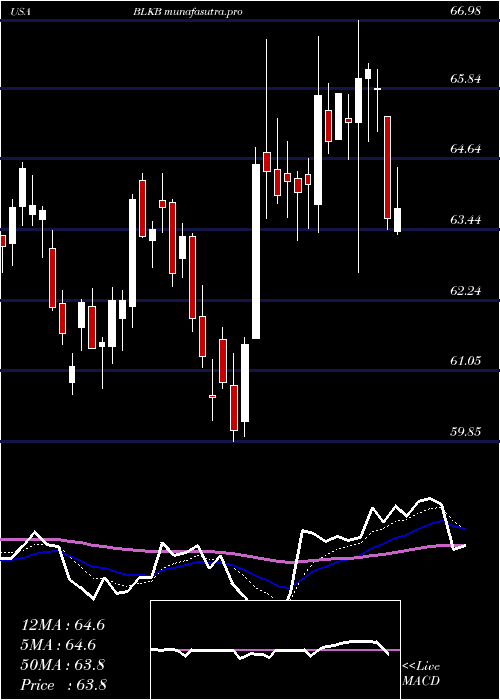
Daily price and charts and targets BlackbaudInc Strong Daily Stock price targets for BlackbaudInc BLKB are 63.77 and 65.14 | Daily Target 1 | 62.65 | | Daily Target 2 | 63.51 | | Daily Target 3 | 64.023333333333 | | Daily Target 4 | 64.88 | | Daily Target 5 | 65.39 |
Daily price and volume Blackbaud Inc
| Date |
Closing |
Open |
Range |
Volume |
Mon 20 October 2025 |
64.36 (2.09%) |
63.24 |
63.17 - 64.54 |
0.7496 times |
Fri 17 October 2025 |
63.04 (0.96%) |
62.44 |
62.19 - 63.65 |
0.8182 times |
Thu 16 October 2025 |
62.44 (-1.58%) |
63.23 |
62.04 - 64.00 |
0.8871 times |
Wed 15 October 2025 |
63.44 (-0.58%) |
63.99 |
62.95 - 65.03 |
0.9304 times |
Tue 14 October 2025 |
63.81 (0.3%) |
63.13 |
62.67 - 64.10 |
1.0923 times |
Mon 13 October 2025 |
63.62 (0.36%) |
63.50 |
62.60 - 64.53 |
1.0069 times |
Fri 10 October 2025 |
63.39 (1.18%) |
62.95 |
62.32 - 64.15 |
1.1133 times |
Thu 09 October 2025 |
62.65 (-0.63%) |
62.89 |
61.94 - 62.89 |
1.6662 times |
Wed 08 October 2025 |
63.05 (0.48%) |
62.50 |
61.31 - 63.11 |
0.8325 times |
Tue 07 October 2025 |
62.75 (-0.76%) |
63.42 |
62.50 - 64.47 |
0.9035 times |
Mon 06 October 2025 |
63.23 (0.3%) |
63.34 |
61.99 - 63.34 |
0.9321 times |
Weekly price and charts BlackbaudInc Strong weekly Stock price targets for BlackbaudInc BLKB are 63.77 and 65.14 | Weekly Target 1 | 62.65 | | Weekly Target 2 | 63.51 | | Weekly Target 3 | 64.023333333333 | | Weekly Target 4 | 64.88 | | Weekly Target 5 | 65.39 |
Weekly price and volumes for Blackbaud Inc
| Date |
Closing |
Open |
Range |
Volume |
Mon 20 October 2025 |
64.36 (2.09%) |
63.24 |
63.17 - 64.54 |
0.1448 times |
Fri 17 October 2025 |
63.04 (-0.55%) |
63.50 |
62.04 - 65.03 |
0.9149 times |
Fri 10 October 2025 |
63.39 (0.56%) |
63.34 |
61.31 - 64.47 |
1.0525 times |
Fri 03 October 2025 |
63.04 (-1.76%) |
64.37 |
62.37 - 64.90 |
1.1027 times |
Fri 26 September 2025 |
64.17 (-3.52%) |
66.25 |
63.37 - 67.24 |
1.4434 times |
Fri 19 September 2025 |
66.51 (-4.44%) |
69.88 |
65.96 - 70.13 |
2.1373 times |
Fri 12 September 2025 |
69.60 (4.5%) |
66.79 |
66.03 - 70.34 |
1.2873 times |
Fri 05 September 2025 |
66.60 (-0.16%) |
65.94 |
64.90 - 67.79 |
0.7766 times |
Fri 29 August 2025 |
66.71 (0%) |
66.35 |
66.19 - 67.47 |
0.1693 times |
Fri 29 August 2025 |
66.71 (0.38%) |
66.36 |
64.89 - 67.47 |
0.9711 times |
Fri 22 August 2025 |
66.46 (5.03%) |
63.35 |
62.53 - 66.92 |
1.153 times |
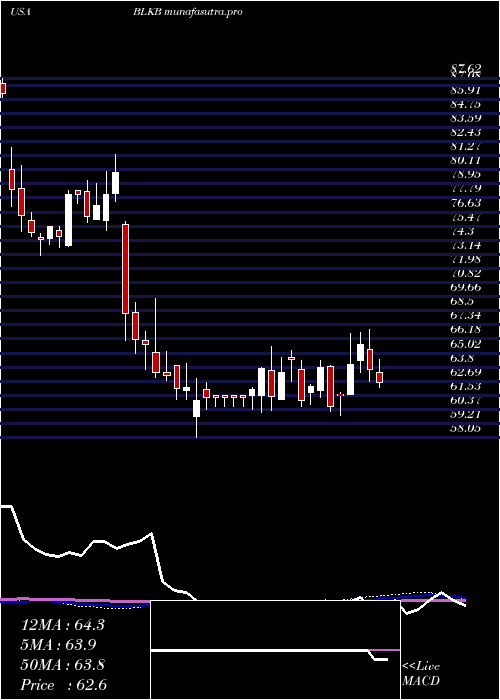
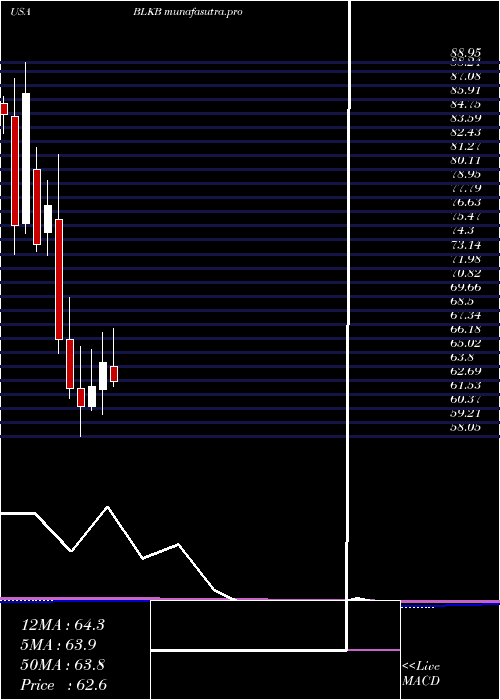
Monthly price and charts BlackbaudInc Strong monthly Stock price targets for BlackbaudInc BLKB are 62.84 and 66.56 | Monthly Target 1 | 59.85 | | Monthly Target 2 | 62.1 | | Monthly Target 3 | 63.566666666667 | | Monthly Target 4 | 65.82 | | Monthly Target 5 | 67.29 |
Monthly price and volumes Blackbaud Inc
| Date |
Closing |
Open |
Range |
Volume |
Mon 20 October 2025 |
64.36 (0.08%) |
64.04 |
61.31 - 65.03 |
0.5546 times |
Tue 30 September 2025 |
64.31 (-3.6%) |
65.94 |
62.37 - 70.34 |
1.3053 times |
Fri 29 August 2025 |
66.71 (-1.05%) |
67.35 |
59.86 - 67.47 |
1.1845 times |
Thu 31 July 2025 |
67.42 (5%) |
63.86 |
62.21 - 74.88 |
1.0185 times |
Mon 30 June 2025 |
64.21 (3.18%) |
61.94 |
59.85 - 66.66 |
1.0007 times |
Fri 30 May 2025 |
62.23 (2.79%) |
60.57 |
60.25 - 65.22 |
0.9925 times |
Wed 30 April 2025 |
60.54 (-2.43%) |
62.05 |
58.05 - 65.54 |
1.1046 times |
Mon 31 March 2025 |
62.05 (-6.13%) |
66.07 |
61.20 - 69.52 |
1.4428 times |
Fri 28 February 2025 |
66.10 (-14.32%) |
75.97 |
64.94 - 81.39 |
0.8309 times |
Fri 31 January 2025 |
77.15 (4.37%) |
74.90 |
73.02 - 79.26 |
0.5656 times |
Tue 31 December 2024 |
73.92 (-14.45%) |
80.14 |
73.34 - 81.97 |
0.5316 times |
DMA SMA EMA moving averages of Blackbaud Inc BLKB
DMA (daily moving average) of Blackbaud Inc BLKB
| DMA period | DMA value | | 5 day DMA | 63.42 | | 12 day DMA | 63.24 | | 20 day DMA | 63.63 | | 35 day DMA | 65.46 | | 50 day DMA | 65.26 | | 100 day DMA | 64.6 | | 150 day DMA | 63.87 | | 200 day DMA | 66.11 | EMA (exponential moving average) of Blackbaud Inc BLKB
| EMA period | EMA current | EMA prev | EMA prev2 | | 5 day EMA | 63.51 | 63.09 | 63.12 | | 12 day EMA | 63.57 | 63.43 | 63.5 | | 20 day EMA | 63.97 | 63.93 | 64.02 | | 35 day EMA | 64.28 | 64.28 | 64.35 | | 50 day EMA | 64.93 | 64.95 | 65.03 |
SMA (simple moving average) of Blackbaud Inc BLKB
| SMA period | SMA current | SMA prev | SMA prev2 | | 5 day SMA | 63.42 | 63.27 | 63.34 | | 12 day SMA | 63.24 | 63.13 | 63.26 | | 20 day SMA | 63.63 | 63.75 | 63.92 | | 35 day SMA | 65.46 | 65.53 | 65.63 | | 50 day SMA | 65.26 | 65.2 | 65.22 | | 100 day SMA | 64.6 | 64.58 | 64.56 | | 150 day SMA | 63.87 | 63.87 | 63.88 | | 200 day SMA | 66.11 | 66.16 | 66.21 |
|
|
