BlacklineInc BL full analysis,charts,indicators,moving averages,SMA,DMA,EMA,ADX,MACD,RSIBlackline Inc BL WideScreen charts, DMA,SMA,EMA technical analysis, forecast prediction, by indicators ADX,MACD,RSI,CCI USA stock exchange
operates under Technology sector & deals in Computer Software Prepackaged Software
Daily price and charts and targets BlacklineInc Strong Daily Stock price targets for BlacklineInc BL are 57.07 and 58.52 | Daily Target 1 | 56.75 | | Daily Target 2 | 57.39 | | Daily Target 3 | 58.196666666667 | | Daily Target 4 | 58.84 | | Daily Target 5 | 59.65 |
Daily price and volume Blackline Inc
| Date |
Closing |
Open |
Range |
Volume |
Thu 04 December 2025 |
58.04 (-1.19%) |
58.51 |
57.55 - 59.00 |
0.9088 times |
Wed 03 December 2025 |
58.74 (1.66%) |
57.48 |
56.56 - 58.90 |
0.8016 times |
Tue 02 December 2025 |
57.78 (3.01%) |
57.03 |
56.36 - 58.37 |
0.9155 times |
Mon 01 December 2025 |
56.09 (-1.58%) |
56.34 |
55.96 - 57.29 |
0.7457 times |
Fri 28 November 2025 |
56.99 (-0.63%) |
57.50 |
56.61 - 57.70 |
0.4334 times |
Wed 26 November 2025 |
57.35 (-0.71%) |
57.36 |
57.18 - 58.06 |
1.0827 times |
Tue 25 November 2025 |
57.76 (2.7%) |
56.53 |
56.30 - 57.90 |
1.2941 times |
Mon 24 November 2025 |
56.24 (2.52%) |
55.25 |
54.86 - 56.44 |
1.2953 times |
Fri 21 November 2025 |
54.86 (2.56%) |
53.49 |
52.82 - 54.94 |
1.3974 times |
Thu 20 November 2025 |
53.49 (-0.24%) |
54.34 |
52.96 - 54.34 |
1.1254 times |
Wed 19 November 2025 |
53.62 (-1.09%) |
54.06 |
53.53 - 54.23 |
0.9734 times |
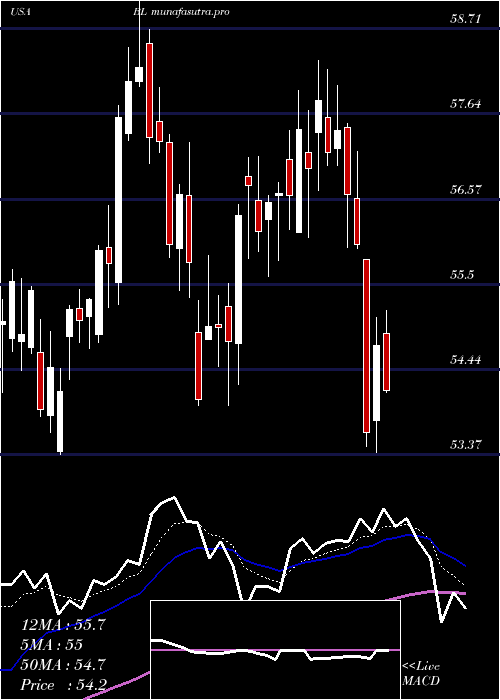
Weekly price and charts BlacklineInc Strong weekly Stock price targets for BlacklineInc BL are 57 and 60.04 | Weekly Target 1 | 54.63 | | Weekly Target 2 | 56.33 | | Weekly Target 3 | 57.666666666667 | | Weekly Target 4 | 59.37 | | Weekly Target 5 | 60.71 |
Weekly price and volumes for Blackline Inc
| Date |
Closing |
Open |
Range |
Volume |
Thu 04 December 2025 |
58.04 (1.84%) |
56.34 |
55.96 - 59.00 |
0.4669 times |
Fri 28 November 2025 |
56.99 (3.88%) |
55.25 |
54.86 - 58.06 |
0.5685 times |
Fri 21 November 2025 |
54.86 (0.35%) |
54.25 |
52.05 - 54.94 |
0.9484 times |
Fri 14 November 2025 |
54.67 (2.03%) |
55.00 |
53.76 - 56.72 |
0.809 times |
Fri 07 November 2025 |
53.58 (-6.41%) |
56.52 |
50.70 - 58.97 |
1.2437 times |
Fri 31 October 2025 |
57.25 (0%) |
56.45 |
56.41 - 58.01 |
0.2211 times |
Fri 31 October 2025 |
57.25 (8.92%) |
52.70 |
52.56 - 59.01 |
2.999 times |
Fri 24 October 2025 |
52.56 (5.5%) |
50.09 |
50.09 - 54.98 |
1.0071 times |
Fri 17 October 2025 |
49.82 (1.49%) |
49.56 |
48.74 - 50.45 |
0.9968 times |
Fri 10 October 2025 |
49.09 (-4.88%) |
51.63 |
48.80 - 52.56 |
0.7393 times |
Fri 03 October 2025 |
51.61 (-2.33%) |
53.13 |
50.51 - 53.32 |
0.6761 times |

Monthly price and charts BlacklineInc Strong monthly Stock price targets for BlacklineInc BL are 57 and 60.04 | Monthly Target 1 | 54.63 | | Monthly Target 2 | 56.33 | | Monthly Target 3 | 57.666666666667 | | Monthly Target 4 | 59.37 | | Monthly Target 5 | 60.71 |
Monthly price and volumes Blackline Inc
| Date |
Closing |
Open |
Range |
Volume |
Thu 04 December 2025 |
58.04 (1.84%) |
56.34 |
55.96 - 59.00 |
0.132 times |
Fri 28 November 2025 |
56.99 (-0.45%) |
56.52 |
50.70 - 58.97 |
1.0088 times |
Fri 31 October 2025 |
57.25 (7.82%) |
52.81 |
48.74 - 59.01 |
1.8025 times |
Tue 30 September 2025 |
53.10 (-2.34%) |
53.81 |
51.35 - 56.05 |
0.9383 times |
Fri 29 August 2025 |
54.37 (1.1%) |
53.65 |
47.94 - 55.05 |
1.3737 times |
Thu 31 July 2025 |
53.78 (-5.02%) |
56.16 |
53.40 - 58.32 |
0.7729 times |
Mon 30 June 2025 |
56.62 (1.23%) |
55.97 |
53.99 - 59.43 |
1.0721 times |
Fri 30 May 2025 |
55.93 (18.42%) |
47.58 |
46.37 - 55.99 |
0.9874 times |
Wed 30 April 2025 |
47.23 (-2.46%) |
48.73 |
40.82 - 49.89 |
1.0357 times |
Mon 31 March 2025 |
48.42 (0.25%) |
48.22 |
46.88 - 51.28 |
0.8767 times |
Fri 28 February 2025 |
48.30 (-24.35%) |
62.26 |
47.69 - 66.02 |
1.3191 times |
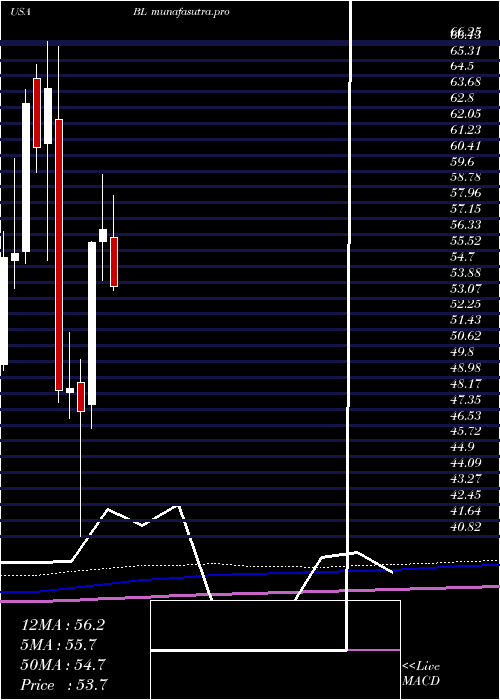
DMA SMA EMA moving averages of Blackline Inc BL
DMA (daily moving average) of Blackline Inc BL
| DMA period | DMA value | | 5 day DMA | 57.53 | | 12 day DMA | 56.26 | | 20 day DMA | 55.7 | | 35 day DMA | 55.14 | | 50 day DMA | 53.95 | | 100 day DMA | 53.82 | | 150 day DMA | 54.2 | | 200 day DMA | 52.52 | EMA (exponential moving average) of Blackline Inc BL
| EMA period | EMA current | EMA prev | EMA prev2 | | 5 day EMA | 57.67 | 57.49 | 56.86 | | 12 day EMA | 56.75 | 56.51 | 56.1 | | 20 day EMA | 56.12 | 55.92 | 55.62 | | 35 day EMA | 55.09 | 54.92 | 54.69 | | 50 day EMA | 54.32 | 54.17 | 53.98 |
SMA (simple moving average) of Blackline Inc BL
| SMA period | SMA current | SMA prev | SMA prev2 | | 5 day SMA | 57.53 | 57.39 | 57.19 | | 12 day SMA | 56.26 | 55.8 | 55.46 | | 20 day SMA | 55.7 | 55.64 | 55.53 | | 35 day SMA | 55.14 | 54.9 | 54.63 | | 50 day SMA | 53.95 | 53.86 | 53.77 | | 100 day SMA | 53.82 | 53.79 | 53.75 | | 150 day SMA | 54.2 | 54.13 | 54.06 | | 200 day SMA | 52.52 | 52.49 | 52.46 |
|
|
