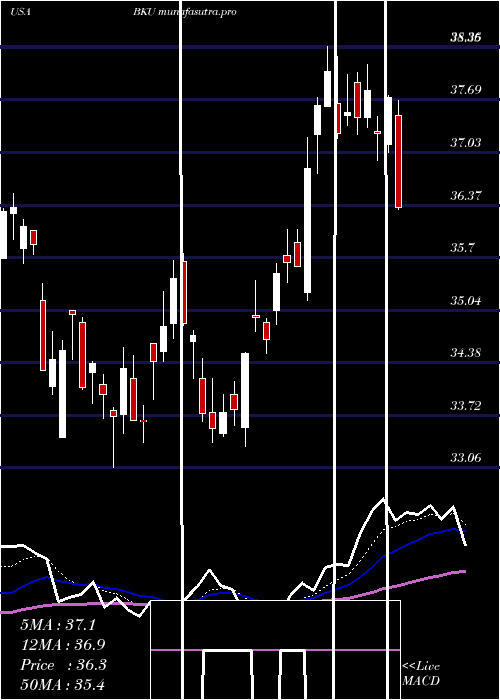
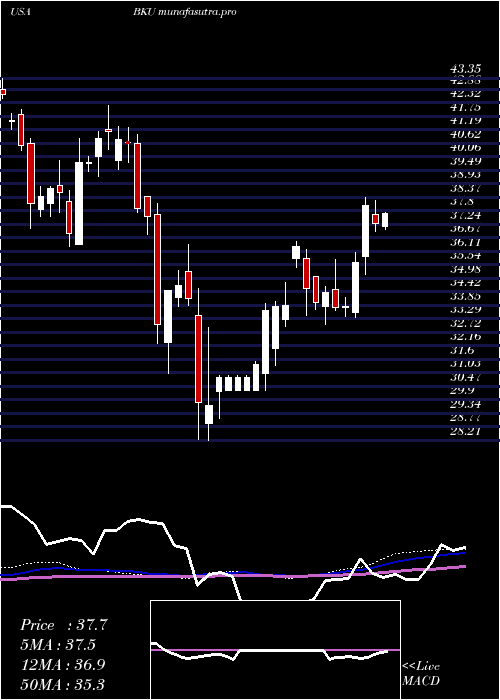
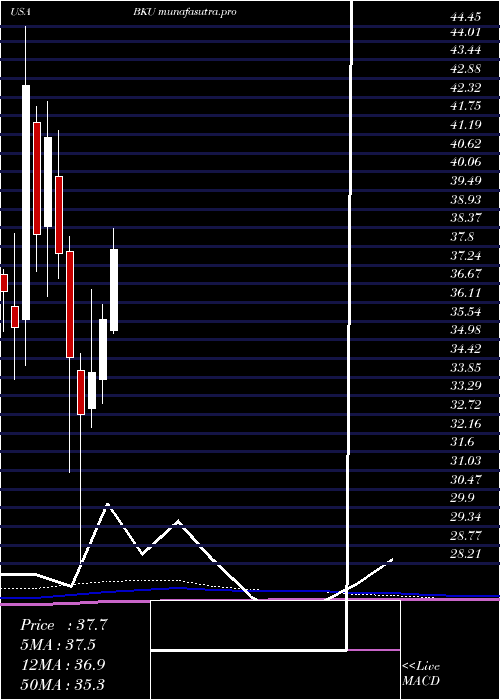
BankunitedInc BKU full analysis,charts,indicators,moving averages,SMA,DMA,EMA,ADX,MACD,RSIBankunited Inc BKU WideScreen charts, DMA,SMA,EMA technical analysis, forecast prediction, by indicators ADX,MACD,RSI,CCI USA stock exchange
operates under Finance sector & deals in Savings Institutions
Daily price and charts and targets BankunitedInc Strong Daily Stock price targets for BankunitedInc BKU are 44.44 and 44.83 | Daily Target 1 | 44.15 | | Daily Target 2 | 44.33 | | Daily Target 3 | 44.543333333333 | | Daily Target 4 | 44.72 | | Daily Target 5 | 44.93 |
Daily price and volume Bankunited Inc
| Date |
Closing |
Open |
Range |
Volume |
Thu 04 December 2025 |
44.50 (-0.13%) |
44.47 |
44.37 - 44.76 |
0.8691 times |
Wed 03 December 2025 |
44.56 (1.25%) |
44.15 |
44.10 - 45.11 |
0.8411 times |
Tue 02 December 2025 |
44.01 (-0.88%) |
44.39 |
43.84 - 44.73 |
0.4091 times |
Mon 01 December 2025 |
44.40 (2.75%) |
44.29 |
43.60 - 44.69 |
1.0735 times |
Fri 28 November 2025 |
43.21 (-0.18%) |
43.28 |
42.88 - 43.39 |
0.3029 times |
Wed 26 November 2025 |
43.29 (-0.09%) |
43.14 |
43.14 - 43.79 |
0.8361 times |
Tue 25 November 2025 |
43.33 (4.21%) |
41.99 |
41.99 - 43.82 |
1.4101 times |
Mon 24 November 2025 |
41.58 (0.24%) |
41.38 |
41.22 - 41.92 |
1.8027 times |
Fri 21 November 2025 |
41.48 (3.44%) |
40.28 |
40.08 - 42.04 |
0.8582 times |
Thu 20 November 2025 |
40.10 (0.65%) |
40.22 |
39.75 - 40.98 |
1.5972 times |
Wed 19 November 2025 |
39.84 (2.31%) |
39.06 |
38.71 - 39.88 |
1.1226 times |
Weekly price and charts BankunitedInc Strong weekly Stock price targets for BankunitedInc BKU are 44.05 and 45.56 | Weekly Target 1 | 42.89 | | Weekly Target 2 | 43.7 | | Weekly Target 3 | 44.403333333333 | | Weekly Target 4 | 45.21 | | Weekly Target 5 | 45.91 |
Weekly price and volumes for Bankunited Inc
| Date |
Closing |
Open |
Range |
Volume |
Thu 04 December 2025 |
44.50 (2.99%) |
44.29 |
43.60 - 45.11 |
0.7173 times |
Fri 28 November 2025 |
43.21 (4.17%) |
41.38 |
41.22 - 43.82 |
0.9777 times |
Fri 21 November 2025 |
41.48 (4.54%) |
39.52 |
38.01 - 42.04 |
1.1179 times |
Fri 14 November 2025 |
39.68 (-1.44%) |
40.23 |
38.83 - 41.01 |
0.7328 times |
Fri 07 November 2025 |
40.26 (0.45%) |
40.19 |
39.51 - 41.08 |
0.7809 times |
Fri 31 October 2025 |
40.08 (0%) |
39.50 |
38.90 - 40.22 |
0.218 times |
Fri 31 October 2025 |
40.08 (5.75%) |
38.26 |
38.26 - 41.40 |
1.4755 times |
Fri 24 October 2025 |
37.90 (4.61%) |
36.48 |
36.05 - 38.21 |
1.0277 times |
Fri 17 October 2025 |
36.23 (-3.82%) |
38.43 |
35.10 - 39.98 |
1.4483 times |
Fri 10 October 2025 |
37.67 (-1.77%) |
38.68 |
37.61 - 40.50 |
1.5037 times |
Fri 03 October 2025 |
38.35 (-0.62%) |
38.75 |
37.36 - 38.75 |
0.6718 times |
Monthly price and charts BankunitedInc Strong monthly Stock price targets for BankunitedInc BKU are 44.05 and 45.56 | Monthly Target 1 | 42.89 | | Monthly Target 2 | 43.7 | | Monthly Target 3 | 44.403333333333 | | Monthly Target 4 | 45.21 | | Monthly Target 5 | 45.91 |
Monthly price and volumes Bankunited Inc
| Date |
Closing |
Open |
Range |
Volume |
Thu 04 December 2025 |
44.50 (2.99%) |
44.29 |
43.60 - 45.11 |
0.2077 times |
Fri 28 November 2025 |
43.21 (7.81%) |
40.19 |
38.01 - 43.82 |
1.045 times |
Fri 31 October 2025 |
40.08 (5.03%) |
37.82 |
35.10 - 41.40 |
1.7741 times |
Tue 30 September 2025 |
38.16 (-2.63%) |
38.63 |
37.37 - 39.86 |
0.941 times |
Fri 29 August 2025 |
39.19 (7.46%) |
35.55 |
34.79 - 39.55 |
0.7965 times |
Thu 31 July 2025 |
36.47 (2.47%) |
35.27 |
35.16 - 39.62 |
1.059 times |
Mon 30 June 2025 |
35.59 (4.74%) |
33.78 |
33.06 - 36.06 |
0.9003 times |
Fri 30 May 2025 |
33.98 (3.88%) |
32.89 |
32.34 - 36.51 |
0.9443 times |
Wed 30 April 2025 |
32.71 (-5.02%) |
34.04 |
28.21 - 34.57 |
1.2942 times |
Mon 31 March 2025 |
34.44 (-8.36%) |
37.66 |
30.98 - 38.10 |
1.0378 times |
Fri 28 February 2025 |
37.58 (-8.59%) |
39.91 |
36.82 - 41.31 |
0.6823 times |
DMA SMA EMA moving averages of Bankunited Inc BKU
DMA (daily moving average) of Bankunited Inc BKU
| DMA period | DMA value | | 5 day DMA | 44.14 | | 12 day DMA | 42.44 | | 20 day DMA | 41.41 | | 35 day DMA | 40.15 | | 50 day DMA | 39.73 | | 100 day DMA | 38.87 | | 150 day DMA | 37.63 | | 200 day DMA | 36.57 | EMA (exponential moving average) of Bankunited Inc BKU
| EMA period | EMA current | EMA prev | EMA prev2 | | 5 day EMA | 44.03 | 43.8 | 43.42 | | 12 day EMA | 42.85 | 42.55 | 42.18 | | 20 day EMA | 41.94 | 41.67 | 41.37 | | 35 day EMA | 40.9 | 40.69 | 40.46 | | 50 day EMA | 40.09 | 39.91 | 39.72 |
SMA (simple moving average) of Bankunited Inc BKU
| SMA period | SMA current | SMA prev | SMA prev2 | | 5 day SMA | 44.14 | 43.89 | 43.65 | | 12 day SMA | 42.44 | 41.92 | 41.51 | | 20 day SMA | 41.41 | 41.2 | 40.98 | | 35 day SMA | 40.15 | 40 | 39.86 | | 50 day SMA | 39.73 | 39.61 | 39.48 | | 100 day SMA | 38.87 | 38.79 | 38.72 | | 150 day SMA | 37.63 | 37.55 | 37.47 | | 200 day SMA | 36.57 | 36.55 | 36.53 |
|
|
