BuckleInc BKE full analysis,charts,indicators,moving averages,SMA,DMA,EMA,ADX,MACD,RSIBuckle Inc BKE WideScreen charts, DMA,SMA,EMA technical analysis, forecast prediction, by indicators ADX,MACD,RSI,CCI USA stock exchange
operates under Consumer Services sector & deals in Clothing Shoe Accessory Stores
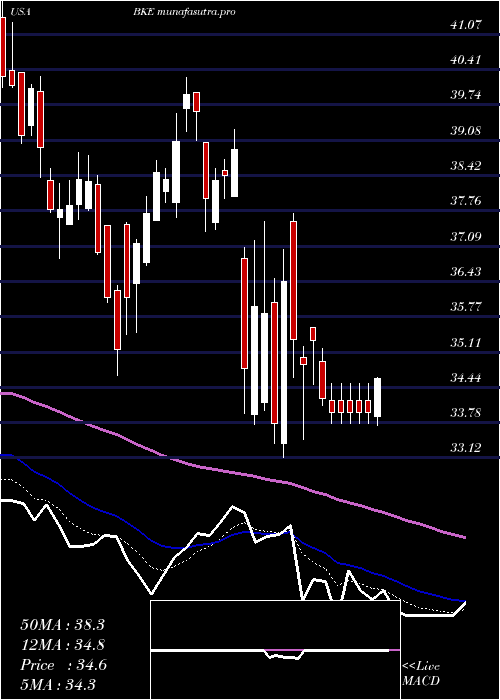
Daily price and charts and targets BuckleInc Strong Daily Stock price targets for BuckleInc BKE are 55.13 and 56.31 | Daily Target 1 | 54.89 | | Daily Target 2 | 55.36 | | Daily Target 3 | 56.07 | | Daily Target 4 | 56.54 | | Daily Target 5 | 57.25 |
Daily price and volume Buckle Inc
| Date |
Closing |
Open |
Range |
Volume |
Fri 05 December 2025 |
55.83 (-1.08%) |
56.40 |
55.60 - 56.78 |
1.2909 times |
Thu 04 December 2025 |
56.44 (-1.69%) |
57.30 |
56.10 - 57.80 |
0.891 times |
Wed 03 December 2025 |
57.41 (2.04%) |
56.50 |
56.33 - 57.69 |
0.8646 times |
Tue 02 December 2025 |
56.26 (-1.28%) |
57.08 |
56.08 - 57.08 |
0.6943 times |
Mon 01 December 2025 |
56.99 (0.9%) |
56.06 |
55.86 - 57.16 |
0.7433 times |
Fri 28 November 2025 |
56.48 (-1.45%) |
57.31 |
56.39 - 57.63 |
0.3909 times |
Wed 26 November 2025 |
57.31 (1.6%) |
56.25 |
56.25 - 57.88 |
0.9878 times |
Tue 25 November 2025 |
56.41 (4.87%) |
54.44 |
54.10 - 56.92 |
1.1052 times |
Mon 24 November 2025 |
53.79 (-0.96%) |
53.71 |
53.41 - 54.96 |
1.5432 times |
Fri 21 November 2025 |
54.31 (-1.29%) |
54.37 |
52.08 - 55.44 |
1.4887 times |
Thu 20 November 2025 |
55.02 (-0.88%) |
55.86 |
55.00 - 56.82 |
1.0805 times |
Weekly price and charts BuckleInc Strong weekly Stock price targets for BuckleInc BKE are 54.62 and 56.82 | Weekly Target 1 | 54.21 | | Weekly Target 2 | 55.02 | | Weekly Target 3 | 56.41 | | Weekly Target 4 | 57.22 | | Weekly Target 5 | 58.61 |
Weekly price and volumes for Buckle Inc
| Date |
Closing |
Open |
Range |
Volume |
Fri 05 December 2025 |
55.83 (-1.15%) |
56.06 |
55.60 - 57.80 |
1.1017 times |
Fri 28 November 2025 |
56.48 (4%) |
53.71 |
53.41 - 57.88 |
0.9894 times |
Fri 21 November 2025 |
54.31 (-3.36%) |
56.06 |
52.08 - 56.82 |
1.0959 times |
Fri 14 November 2025 |
56.20 (-1.95%) |
58.26 |
55.55 - 58.42 |
0.9182 times |
Fri 07 November 2025 |
57.32 (4.6%) |
54.39 |
53.93 - 58.33 |
1.0527 times |
Fri 31 October 2025 |
54.80 (0%) |
53.99 |
53.40 - 54.99 |
0.279 times |
Fri 31 October 2025 |
54.80 (-1.62%) |
56.17 |
53.40 - 56.61 |
1.1768 times |
Fri 24 October 2025 |
55.70 (2.52%) |
54.81 |
54.62 - 56.44 |
0.8833 times |
Fri 17 October 2025 |
54.33 (3.03%) |
53.85 |
52.67 - 54.49 |
1.3192 times |
Fri 10 October 2025 |
52.73 (-8.3%) |
57.42 |
52.49 - 58.67 |
1.1839 times |
Fri 03 October 2025 |
57.50 (-3.83%) |
60.08 |
56.64 - 60.08 |
1.1604 times |
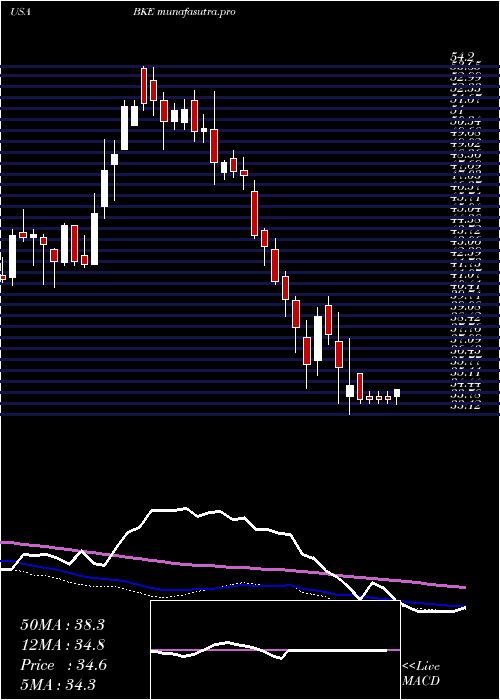
Monthly price and charts BuckleInc Strong monthly Stock price targets for BuckleInc BKE are 54.62 and 56.82 | Monthly Target 1 | 54.21 | | Monthly Target 2 | 55.02 | | Monthly Target 3 | 56.41 | | Monthly Target 4 | 57.22 | | Monthly Target 5 | 58.61 |
Monthly price and volumes Buckle Inc
| Date |
Closing |
Open |
Range |
Volume |
Fri 05 December 2025 |
55.83 (-1.15%) |
56.06 |
55.60 - 57.80 |
0.2163 times |
Fri 28 November 2025 |
56.48 (3.07%) |
54.39 |
52.08 - 58.42 |
0.7965 times |
Fri 31 October 2025 |
54.80 (-6.58%) |
58.51 |
52.49 - 58.68 |
1.0611 times |
Tue 30 September 2025 |
58.66 (3.66%) |
55.95 |
55.90 - 61.69 |
1.1934 times |
Fri 29 August 2025 |
56.59 (14.62%) |
48.78 |
47.70 - 57.83 |
1.1919 times |
Thu 31 July 2025 |
49.37 (8.86%) |
45.30 |
44.92 - 50.31 |
0.8864 times |
Mon 30 June 2025 |
45.35 (6.43%) |
42.61 |
42.09 - 45.78 |
0.9269 times |
Fri 30 May 2025 |
42.61 (22.58%) |
34.98 |
34.64 - 43.64 |
1.0759 times |
Wed 30 April 2025 |
34.76 (-9.29%) |
38.52 |
33.12 - 39.27 |
1.1756 times |
Mon 31 March 2025 |
38.32 (-4.32%) |
40.00 |
34.67 - 40.28 |
1.4758 times |
Fri 28 February 2025 |
40.05 (-15.88%) |
46.62 |
39.02 - 47.27 |
0.8792 times |

DMA SMA EMA moving averages of Buckle Inc BKE
DMA (daily moving average) of Buckle Inc BKE
| DMA period | DMA value | | 5 day DMA | 56.59 | | 12 day DMA | 55.98 | | 20 day DMA | 56.19 | | 35 day DMA | 55.8 | | 50 day DMA | 55.95 | | 100 day DMA | 55.66 | | 150 day DMA | 51.46 | | 200 day DMA | 47.79 | EMA (exponential moving average) of Buckle Inc BKE
| EMA period | EMA current | EMA prev | EMA prev2 | | 5 day EMA | 56.36 | 56.62 | 56.71 | | 12 day EMA | 56.23 | 56.3 | 56.28 | | 20 day EMA | 56.15 | 56.18 | 56.15 | | 35 day EMA | 56.23 | 56.25 | 56.24 | | 50 day EMA | 56.31 | 56.33 | 56.33 |
SMA (simple moving average) of Buckle Inc BKE
| SMA period | SMA current | SMA prev | SMA prev2 | | 5 day SMA | 56.59 | 56.72 | 56.89 | | 12 day SMA | 55.98 | 55.96 | 55.88 | | 20 day SMA | 56.19 | 56.23 | 56.3 | | 35 day SMA | 55.8 | 55.74 | 55.66 | | 50 day SMA | 55.95 | 56.01 | 56.06 | | 100 day SMA | 55.66 | 55.58 | 55.49 | | 150 day SMA | 51.46 | 51.32 | 51.17 | | 200 day SMA | 47.79 | 47.72 | 47.65 |
|
|
