BrookfieldInfrastructure BIP full analysis,charts,indicators,moving averages,SMA,DMA,EMA,ADX,MACD,RSIBrookfield Infrastructure BIP WideScreen charts, DMA,SMA,EMA technical analysis, forecast prediction, by indicators ADX,MACD,RSI,CCI USA stock exchange
operates under Consumer Services sector & deals in Marine Transportation
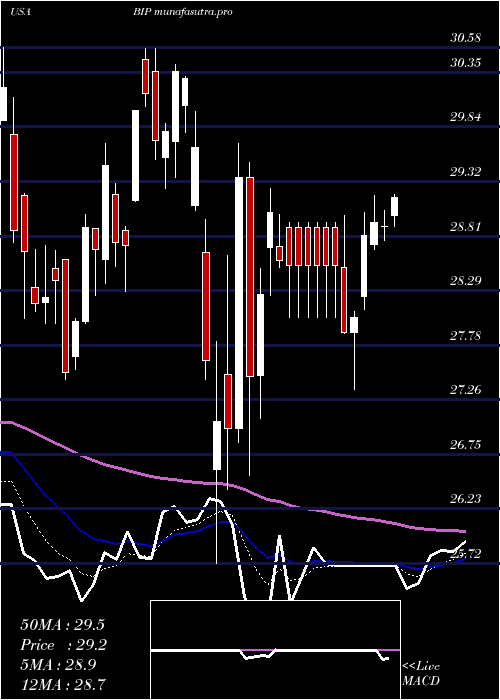
Daily price and charts and targets BrookfieldInfrastructure Strong Daily Stock price targets for BrookfieldInfrastructure BIP are 34.58 and 34.98 | Daily Target 1 | 34.28 | | Daily Target 2 | 34.47 | | Daily Target 3 | 34.676666666667 | | Daily Target 4 | 34.87 | | Daily Target 5 | 35.08 |
Daily price and volume Brookfield Infrastructure
| Date |
Closing |
Open |
Range |
Volume |
Tue 21 October 2025 |
34.67 (-0.46%) |
34.57 |
34.48 - 34.88 |
0.5681 times |
Mon 20 October 2025 |
34.83 (1.55%) |
34.50 |
34.39 - 34.95 |
0.7619 times |
Fri 17 October 2025 |
34.30 (0.97%) |
34.00 |
33.86 - 34.46 |
1.3025 times |
Thu 16 October 2025 |
33.97 (-1.68%) |
34.71 |
33.84 - 34.78 |
1.2081 times |
Wed 15 October 2025 |
34.55 (-0.89%) |
35.00 |
34.48 - 35.31 |
1.1825 times |
Tue 14 October 2025 |
34.86 (0.49%) |
34.25 |
34.04 - 35.01 |
1.098 times |
Mon 13 October 2025 |
34.69 (0.9%) |
35.21 |
34.41 - 35.21 |
0.8837 times |
Fri 10 October 2025 |
34.38 (1.12%) |
33.77 |
33.73 - 34.74 |
1.3032 times |
Thu 09 October 2025 |
34.00 (-1.71%) |
34.05 |
33.90 - 34.60 |
1.0966 times |
Wed 08 October 2025 |
34.59 (-0.09%) |
34.60 |
34.44 - 34.71 |
0.5955 times |
Tue 07 October 2025 |
34.62 (0.79%) |
34.21 |
34.06 - 34.77 |
0.9146 times |
Weekly price and charts BrookfieldInfrastructure Strong weekly Stock price targets for BrookfieldInfrastructure BIP are 34.53 and 35.09 | Weekly Target 1 | 34.11 | | Weekly Target 2 | 34.39 | | Weekly Target 3 | 34.67 | | Weekly Target 4 | 34.95 | | Weekly Target 5 | 35.23 |
Weekly price and volumes for Brookfield Infrastructure
| Date |
Closing |
Open |
Range |
Volume |
Tue 21 October 2025 |
34.67 (1.08%) |
34.50 |
34.39 - 34.95 |
0.3074 times |
Fri 17 October 2025 |
34.30 (-0.23%) |
35.21 |
33.84 - 35.31 |
1.3119 times |
Fri 10 October 2025 |
34.38 (1.72%) |
34.55 |
33.73 - 34.77 |
1.0687 times |
Fri 03 October 2025 |
33.80 (2.05%) |
33.07 |
32.74 - 34.32 |
0.9202 times |
Fri 26 September 2025 |
33.12 (7.15%) |
30.93 |
30.72 - 33.13 |
1.8611 times |
Fri 19 September 2025 |
30.91 (0.82%) |
30.66 |
30.53 - 31.37 |
1.2111 times |
Fri 12 September 2025 |
30.66 (0.49%) |
30.62 |
30.46 - 31.20 |
1.1561 times |
Fri 05 September 2025 |
30.51 (-2.99%) |
31.09 |
30.09 - 31.56 |
0.9143 times |
Fri 29 August 2025 |
31.45 (0%) |
31.20 |
31.20 - 31.73 |
0.2223 times |
Fri 29 August 2025 |
31.45 (2.54%) |
30.64 |
30.33 - 32.03 |
1.027 times |
Fri 22 August 2025 |
30.67 (2.88%) |
29.85 |
29.75 - 30.80 |
1.236 times |
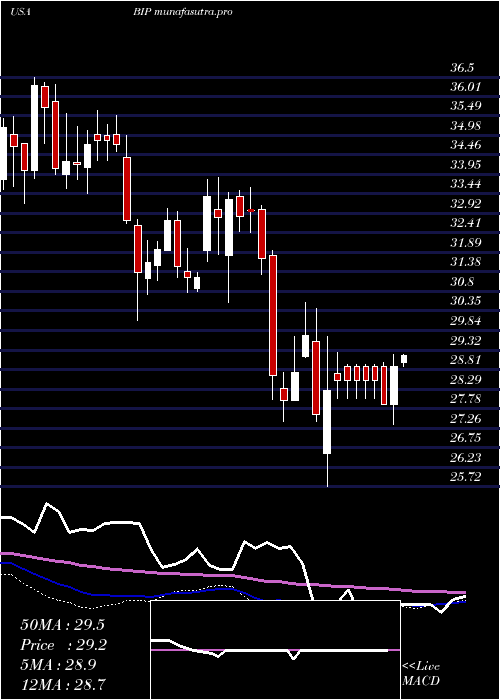
Monthly price and charts BrookfieldInfrastructure Strong monthly Stock price targets for BrookfieldInfrastructure BIP are 33.75 and 36.24 | Monthly Target 1 | 31.78 | | Monthly Target 2 | 33.22 | | Monthly Target 3 | 34.266666666667 | | Monthly Target 4 | 35.71 | | Monthly Target 5 | 36.76 |
Monthly price and volumes Brookfield Infrastructure
| Date |
Closing |
Open |
Range |
Volume |
Tue 21 October 2025 |
34.67 (5.41%) |
32.95 |
32.82 - 35.31 |
0.7411 times |
Tue 30 September 2025 |
32.89 (4.58%) |
31.09 |
30.09 - 33.44 |
1.3028 times |
Fri 29 August 2025 |
31.45 (0.8%) |
31.32 |
29.63 - 32.59 |
1.1484 times |
Thu 31 July 2025 |
31.20 (-6.87%) |
33.60 |
30.15 - 34.24 |
0.8788 times |
Mon 30 June 2025 |
33.50 (1.18%) |
33.10 |
32.07 - 34.32 |
0.7936 times |
Fri 30 May 2025 |
33.11 (10.33%) |
30.01 |
29.19 - 33.59 |
0.8751 times |
Wed 30 April 2025 |
30.01 (0.74%) |
29.70 |
25.72 - 30.47 |
1.4049 times |
Mon 31 March 2025 |
29.79 (-6.08%) |
31.80 |
27.45 - 31.95 |
1.2178 times |
Fri 28 February 2025 |
31.72 (-3.32%) |
31.81 |
30.57 - 33.61 |
0.9181 times |
Fri 31 January 2025 |
32.81 (3.21%) |
32.07 |
30.83 - 33.86 |
0.7193 times |
Tue 31 December 2024 |
31.79 (-8.73%) |
35.00 |
30.10 - 35.50 |
0.6111 times |

DMA SMA EMA moving averages of Brookfield Infrastructure BIP
DMA (daily moving average) of Brookfield Infrastructure BIP
| DMA period | DMA value | | 5 day DMA | 34.46 | | 12 day DMA | 34.48 | | 20 day DMA | 33.8 | | 35 day DMA | 32.54 | | 50 day DMA | 31.99 | | 100 day DMA | 32.26 | | 150 day DMA | 31.54 | | 200 day DMA | 31.55 | EMA (exponential moving average) of Brookfield Infrastructure BIP
| EMA period | EMA current | EMA prev | EMA prev2 | | 5 day EMA | 34.56 | 34.5 | 34.33 | | 12 day EMA | 34.25 | 34.17 | 34.05 | | 20 day EMA | 33.76 | 33.66 | 33.54 | | 35 day EMA | 32.99 | 32.89 | 32.78 | | 50 day EMA | 32.11 | 32.01 | 31.89 |
SMA (simple moving average) of Brookfield Infrastructure BIP
| SMA period | SMA current | SMA prev | SMA prev2 | | 5 day SMA | 34.46 | 34.5 | 34.47 | | 12 day SMA | 34.48 | 34.41 | 34.29 | | 20 day SMA | 33.8 | 33.65 | 33.47 | | 35 day SMA | 32.54 | 32.45 | 32.35 | | 50 day SMA | 31.99 | 31.9 | 31.81 | | 100 day SMA | 32.26 | 32.25 | 32.24 | | 150 day SMA | 31.54 | 31.5 | 31.46 | | 200 day SMA | 31.55 | 31.54 | 31.53 |
|
|
