BioRad BIO.B full analysis,charts,indicators,moving averages,SMA,DMA,EMA,ADX,MACD,RSIBio Rad BIO.B WideScreen charts, DMA,SMA,EMA technical analysis, forecast prediction, by indicators ADX,MACD,RSI,CCI USA stock exchange
operates under N A sector & deals in N A
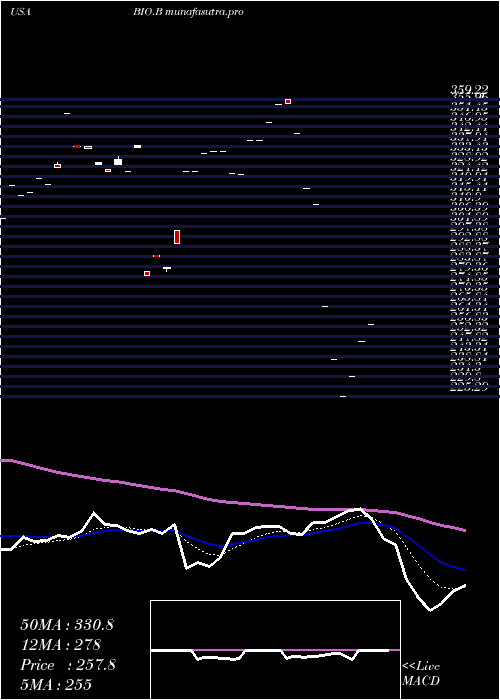
Daily price and charts and targets BioRad Strong Daily Stock price targets for BioRad BIO.B are 257.75 and 257.75 | Daily Target 1 | 257.75 | | Daily Target 2 | 257.75 | | Daily Target 3 | 257.75 | | Daily Target 4 | 257.75 | | Daily Target 5 | 257.75 |
Daily price and volume Bio Rad
| Date |
Closing |
Open |
Range |
Volume |
Fri 11 July 2025 |
257.75 (3.07%) |
257.75 |
257.75 - 257.75 |
0.5556 times |
Tue 13 May 2025 |
250.08 (6.68%) |
250.08 |
250.08 - 250.08 |
1.1111 times |
Mon 21 April 2025 |
234.41 (4.05%) |
234.41 |
234.41 - 234.41 |
0.5556 times |
Wed 09 April 2025 |
225.29 (-6.9%) |
225.29 |
225.29 - 225.29 |
1.1111 times |
Mon 31 March 2025 |
241.99 (-8.96%) |
241.99 |
241.99 - 241.99 |
0.5556 times |
Mon 03 March 2025 |
265.82 (-14.81%) |
265.82 |
265.82 - 265.82 |
0.5556 times |
Thu 13 February 2025 |
312.05 (-2.29%) |
312.05 |
312.05 - 312.05 |
1.1111 times |
Wed 12 February 2025 |
319.37 (-7.12%) |
319.37 |
319.37 - 319.37 |
1.6667 times |
Thu 06 February 2025 |
343.85 (-3.86%) |
343.85 |
343.85 - 343.85 |
1.1111 times |
Wed 29 January 2025 |
357.65 (0.17%) |
359.22 |
357.65 - 359.22 |
1.6667 times |
Fri 24 January 2025 |
357.05 (2.32%) |
357.05 |
357.05 - 357.05 |
1.6667 times |
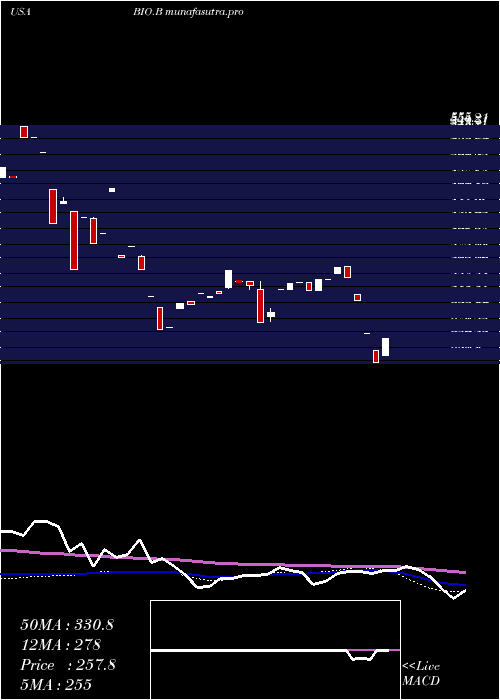
Weekly price and charts BioRad Strong weekly Stock price targets for BioRad BIO.B are 246.08 and 269.42 | Weekly Target 1 | 226.63 | | Weekly Target 2 | 242.19 | | Weekly Target 3 | 249.97 | | Weekly Target 4 | 265.53 | | Weekly Target 5 | 273.31 |
Weekly price and volumes for Bio Rad
| Date |
Closing |
Open |
Range |
Volume |
Fri 11 July 2025 |
257.75 (14.41%) |
234.41 |
234.41 - 257.75 |
1.1422 times |
Wed 09 April 2025 |
225.29 (-15.25%) |
241.99 |
225.29 - 241.99 |
0.8567 times |
Mon 03 March 2025 |
265.82 (-14.81%) |
265.82 |
265.82 - 265.82 |
0.2856 times |
Thu 13 February 2025 |
312.05 (-9.25%) |
319.37 |
312.05 - 319.37 |
1.4278 times |
Thu 06 February 2025 |
343.85 (-3.7%) |
359.22 |
343.85 - 359.22 |
1.4278 times |
Fri 24 January 2025 |
357.05 (4.71%) |
348.95 |
348.95 - 357.05 |
1.7133 times |
Wed 08 January 2025 |
341.00 (0%) |
341.00 |
341.00 - 341.00 |
0.8567 times |
Wed 08 January 2025 |
341.00 (4.65%) |
325.60 |
325.60 - 341.00 |
1.1508 times |
Wed 18 December 2024 |
325.85 (-3.02%) |
336.00 |
325.85 - 336.00 |
0.8538 times |
Tue 26 November 2024 |
336.00 (0.34%) |
336.00 |
336.00 - 336.00 |
0.2856 times |
Thu 03 October 2024 |
334.85 (2.47%) |
326.74 |
326.74 - 334.85 |
0.5711 times |
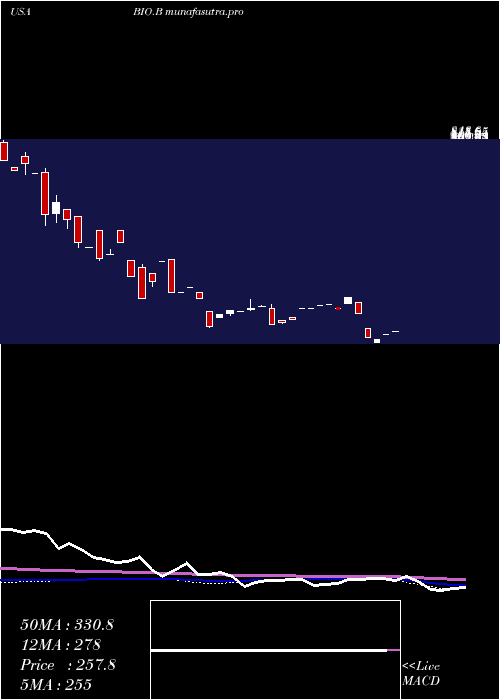
Monthly price and charts BioRad Strong monthly Stock price targets for BioRad BIO.B are 257.75 and 257.75 | Monthly Target 1 | 257.75 | | Monthly Target 2 | 257.75 | | Monthly Target 3 | 257.75 | | Monthly Target 4 | 257.75 | | Monthly Target 5 | 257.75 |
Monthly price and volumes Bio Rad
| Date |
Closing |
Open |
Range |
Volume |
Fri 11 July 2025 |
257.75 (3.07%) |
257.75 |
257.75 - 257.75 |
0.2701 times |
Tue 13 May 2025 |
250.08 (6.68%) |
250.08 |
250.08 - 250.08 |
0.5402 times |
Mon 21 April 2025 |
234.41 (-3.13%) |
225.29 |
225.29 - 234.41 |
0.8104 times |
Mon 31 March 2025 |
241.99 (-22.45%) |
265.82 |
241.99 - 265.82 |
0.5402 times |
Thu 13 February 2025 |
312.05 (-12.75%) |
343.85 |
312.05 - 343.85 |
1.8909 times |
Wed 29 January 2025 |
357.65 (9.84%) |
341.00 |
341.00 - 359.22 |
4.0519 times |
Mon 30 December 2024 |
325.60 (-3.1%) |
325.85 |
325.60 - 325.85 |
0.8158 times |
Tue 26 November 2024 |
336.00 (0.34%) |
336.00 |
336.00 - 336.00 |
0.5402 times |
Thu 03 October 2024 |
334.85 (2.48%) |
334.85 |
334.85 - 334.85 |
0.2701 times |
Wed 11 September 2024 |
326.74 (-0.01%) |
326.74 |
326.74 - 326.74 |
0.2701 times |
Fri 02 August 2024 |
326.78 (11.06%) |
326.78 |
326.78 - 326.78 |
0.3187 times |
DMA SMA EMA moving averages of Bio Rad BIO.B
DMA (daily moving average) of Bio Rad BIO.B
| DMA period | DMA value | | 5 day DMA | 241.9 | | 12 day DMA | 292.86 | | 20 day DMA | 309.07 | | 35 day DMA | 313.91 | | 50 day DMA | 313.75 | | 100 day DMA | 404.74 | | 150 day DMA | 494.4 | | 200 day DMA | 522.16 | EMA (exponential moving average) of Bio Rad BIO.B
| EMA period | EMA current | EMA prev | EMA prev2 | | 5 day EMA | 255 | 253.62 | 255.39 | | 12 day EMA | 278.04 | 281.73 | 287.48 | | 20 day EMA | 293.15 | 296.88 | 301.8 | | 35 day EMA | 308.15 | 311.12 | 314.71 | | 50 day EMA | 314.81 | 317.14 | 319.88 |
SMA (simple moving average) of Bio Rad BIO.B
| SMA period | SMA current | SMA prev | SMA prev2 | | 5 day SMA | 241.9 | 243.52 | 255.91 | | 12 day SMA | 292.86 | 299.79 | 307.37 | | 20 day SMA | 309.07 | 312.52 | 314.72 | | 35 day SMA | 313.91 | 315.79 | 317.71 | | 50 day SMA | 313.75 | 316.34 | 318.76 | | 100 day SMA | 404.74 | 408.55 | 412.63 | | 150 day SMA | 494.4 | 496.69 | 499.03 | | 200 day SMA | 522.16 | 523.86 | 525.39 |
|
|
