BlackrockCore BHK full analysis,charts,indicators,moving averages,SMA,DMA,EMA,ADX,MACD,RSIBlackrock Core BHK WideScreen charts, DMA,SMA,EMA technical analysis, forecast prediction, by indicators ADX,MACD,RSI,CCI USA stock exchange
operates under N A sector & deals in N A
Daily price and charts and targets BlackrockCore Strong Daily Stock price targets for BlackrockCore BHK are 9.49 and 9.54 | Daily Target 1 | 9.48 | | Daily Target 2 | 9.49 | | Daily Target 3 | 9.5266666666667 | | Daily Target 4 | 9.54 | | Daily Target 5 | 9.58 |
Daily price and volume Blackrock Core
| Date |
Closing |
Open |
Range |
Volume |
Thu 04 December 2025 |
9.51 (-0.52%) |
9.55 |
9.51 - 9.56 |
1.0503 times |
Wed 03 December 2025 |
9.56 (0.21%) |
9.52 |
9.52 - 9.59 |
0.9616 times |
Tue 02 December 2025 |
9.54 (0.21%) |
9.59 |
9.49 - 9.59 |
1.1281 times |
Mon 01 December 2025 |
9.52 (-1.86%) |
9.64 |
9.51 - 9.64 |
2.092 times |
Fri 28 November 2025 |
9.70 (0.31%) |
9.69 |
9.63 - 9.70 |
0.4838 times |
Wed 26 November 2025 |
9.67 (0.31%) |
9.64 |
9.61 - 9.69 |
0.4229 times |
Tue 25 November 2025 |
9.64 (0.84%) |
9.60 |
9.56 - 9.64 |
0.7917 times |
Mon 24 November 2025 |
9.56 (0.84%) |
9.47 |
9.47 - 9.57 |
0.5586 times |
Fri 21 November 2025 |
9.48 (0.74%) |
9.47 |
9.43 - 9.49 |
1.0124 times |
Thu 20 November 2025 |
9.41 (-0.11%) |
9.47 |
9.39 - 9.47 |
1.4985 times |
Wed 19 November 2025 |
9.42 (-0.74%) |
9.54 |
9.39 - 9.55 |
1.6801 times |
Weekly price and charts BlackrockCore Strong weekly Stock price targets for BlackrockCore BHK are 9.43 and 9.58 | Weekly Target 1 | 9.4 | | Weekly Target 2 | 9.45 | | Weekly Target 3 | 9.5466666666667 | | Weekly Target 4 | 9.6 | | Weekly Target 5 | 9.7 |
Weekly price and volumes for Blackrock Core
| Date |
Closing |
Open |
Range |
Volume |
Thu 04 December 2025 |
9.51 (-1.96%) |
9.64 |
9.49 - 9.64 |
1.201 times |
Fri 28 November 2025 |
9.70 (2.32%) |
9.47 |
9.47 - 9.70 |
0.5181 times |
Fri 21 November 2025 |
9.48 (-0.84%) |
9.59 |
9.39 - 9.62 |
1.3219 times |
Fri 14 November 2025 |
9.56 (-1.75%) |
9.74 |
9.55 - 9.77 |
0.926 times |
Fri 07 November 2025 |
9.73 (-0.71%) |
9.72 |
9.66 - 9.80 |
0.9408 times |
Fri 31 October 2025 |
9.80 (0%) |
9.77 |
9.69 - 9.80 |
0.3312 times |
Fri 31 October 2025 |
9.80 (-1.01%) |
9.90 |
9.67 - 9.94 |
1.726 times |
Fri 24 October 2025 |
9.90 (0.41%) |
9.88 |
9.83 - 10.00 |
1.0927 times |
Fri 17 October 2025 |
9.86 (-1.2%) |
10.01 |
9.83 - 10.03 |
0.9434 times |
Fri 10 October 2025 |
9.98 (-0.5%) |
10.02 |
9.96 - 10.12 |
0.9989 times |
Fri 03 October 2025 |
10.03 (1.83%) |
9.89 |
9.86 - 10.04 |
1.5716 times |

Monthly price and charts BlackrockCore Strong monthly Stock price targets for BlackrockCore BHK are 9.43 and 9.58 | Monthly Target 1 | 9.4 | | Monthly Target 2 | 9.45 | | Monthly Target 3 | 9.5466666666667 | | Monthly Target 4 | 9.6 | | Monthly Target 5 | 9.7 |
Monthly price and volumes Blackrock Core
| Date |
Closing |
Open |
Range |
Volume |
Thu 04 December 2025 |
9.51 (-1.96%) |
9.64 |
9.49 - 9.64 |
0.308 times |
Fri 28 November 2025 |
9.70 (-1.02%) |
9.72 |
9.39 - 9.80 |
0.9508 times |
Fri 31 October 2025 |
9.80 (-1.41%) |
9.97 |
9.67 - 10.12 |
1.4634 times |
Tue 30 September 2025 |
9.94 (2.58%) |
9.62 |
9.55 - 10.03 |
1.4879 times |
Fri 29 August 2025 |
9.69 (1.04%) |
9.65 |
9.53 - 9.76 |
1.1753 times |
Thu 31 July 2025 |
9.59 (-1.34%) |
9.72 |
9.41 - 9.76 |
1.4562 times |
Mon 30 June 2025 |
9.72 (-3.67%) |
10.04 |
9.49 - 10.07 |
1.1511 times |
Fri 30 May 2025 |
10.09 (-4%) |
10.53 |
9.87 - 10.58 |
1.0327 times |
Wed 30 April 2025 |
10.51 (-3.13%) |
10.82 |
9.79 - 11.00 |
0.5495 times |
Mon 31 March 2025 |
10.85 (1.31%) |
10.67 |
10.60 - 10.91 |
0.425 times |
Fri 28 February 2025 |
10.71 (1.32%) |
10.53 |
10.41 - 10.78 |
0.4961 times |

DMA SMA EMA moving averages of Blackrock Core BHK
DMA (daily moving average) of Blackrock Core BHK
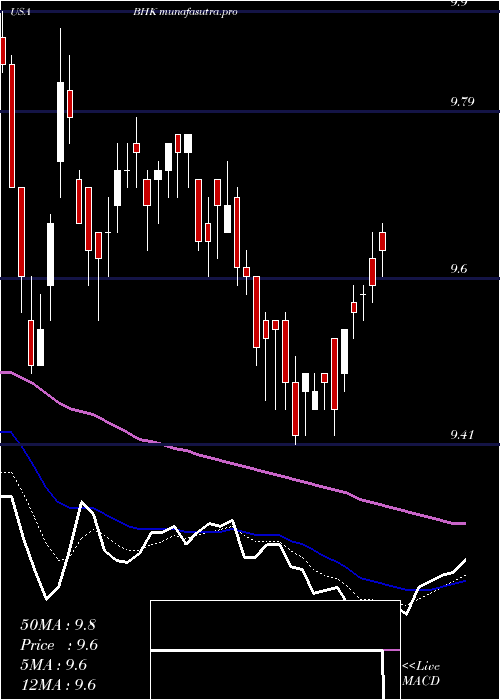
| DMA period | DMA value | | 5 day DMA | 9.57 | | 12 day DMA | 9.54 | | 20 day DMA | 9.6 | | 35 day DMA | 9.7 | | 50 day DMA | 9.78 | | 100 day DMA | 9.73 | | 150 day DMA | 9.8 | | 200 day DMA | 9.98 | EMA (exponential moving average) of Blackrock Core BHK
| EMA period | EMA current | EMA prev | EMA prev2 | | 5 day EMA | 9.55 | 9.57 | 9.57 | | 12 day EMA | 9.58 | 9.59 | 9.59 | | 20 day EMA | 9.61 | 9.62 | 9.63 | | 35 day EMA | 9.68 | 9.69 | 9.7 | | 50 day EMA | 9.77 | 9.78 | 9.79 |
SMA (simple moving average) of Blackrock Core BHK
| SMA period | SMA current | SMA prev | SMA prev2 | | 5 day SMA | 9.57 | 9.6 | 9.61 | | 12 day SMA | 9.54 | 9.55 | 9.55 | | 20 day SMA | 9.6 | 9.61 | 9.62 | | 35 day SMA | 9.7 | 9.71 | 9.72 | | 50 day SMA | 9.78 | 9.79 | 9.79 | | 100 day SMA | 9.73 | 9.73 | 9.73 | | 150 day SMA | 9.8 | 9.81 | 9.82 | | 200 day SMA | 9.98 | 9.98 | 9.98 |
|
|
