BrighthouseFinancial BHFAL full analysis,charts,indicators,moving averages,SMA,DMA,EMA,ADX,MACD,RSIBrighthouse Financial BHFAL WideScreen charts, DMA,SMA,EMA technical analysis, forecast prediction, by indicators ADX,MACD,RSI,CCI USA stock exchange
operates under Finance sector & deals in Life Insurance
Daily price and charts and targets BrighthouseFinancial Strong Daily Stock price targets for BrighthouseFinancial BHFAL are 18.04 and 18.58 | Daily Target 1 | 17.91 | | Daily Target 2 | 18.17 | | Daily Target 3 | 18.45 | | Daily Target 4 | 18.71 | | Daily Target 5 | 18.99 |
Daily price and volume Brighthouse Financial
| Date |
Closing |
Open |
Range |
Volume |
Mon 20 October 2025 |
18.43 (-0.86%) |
18.69 |
18.19 - 18.73 |
0.8131 times |
Fri 17 October 2025 |
18.59 (-0.38%) |
18.57 |
18.40 - 18.83 |
1.5243 times |
Thu 16 October 2025 |
18.66 (4.25%) |
17.78 |
17.45 - 18.84 |
2.3787 times |
Wed 15 October 2025 |
17.90 (1.19%) |
17.60 |
17.55 - 18.07 |
0.6808 times |
Tue 14 October 2025 |
17.69 (1.2%) |
17.46 |
17.42 - 17.88 |
0.5237 times |
Mon 13 October 2025 |
17.48 (0.06%) |
17.54 |
17.41 - 17.55 |
0.769 times |
Fri 10 October 2025 |
17.47 (-1.74%) |
17.75 |
17.45 - 17.87 |
0.8049 times |
Thu 09 October 2025 |
17.78 (-0.11%) |
17.76 |
17.74 - 17.88 |
0.6891 times |
Wed 08 October 2025 |
17.80 (-1.11%) |
17.95 |
17.74 - 18.03 |
0.9647 times |
Tue 07 October 2025 |
18.00 (-0.72%) |
18.01 |
17.96 - 18.11 |
0.8517 times |
Mon 06 October 2025 |
18.13 (0.06%) |
18.10 |
18.00 - 18.55 |
0.7277 times |
Weekly price and charts BrighthouseFinancial Strong weekly Stock price targets for BrighthouseFinancial BHFAL are 18.04 and 18.58 | Weekly Target 1 | 17.91 | | Weekly Target 2 | 18.17 | | Weekly Target 3 | 18.45 | | Weekly Target 4 | 18.71 | | Weekly Target 5 | 18.99 |
Weekly price and volumes for Brighthouse Financial
| Date |
Closing |
Open |
Range |
Volume |
Mon 20 October 2025 |
18.43 (-0.86%) |
18.69 |
18.19 - 18.73 |
0.2184 times |
Fri 17 October 2025 |
18.59 (6.41%) |
17.54 |
17.41 - 18.84 |
1.5787 times |
Fri 10 October 2025 |
17.47 (-3.59%) |
18.10 |
17.45 - 18.55 |
1.0848 times |
Fri 03 October 2025 |
18.12 (-0.6%) |
18.19 |
18.00 - 18.63 |
1.1005 times |
Fri 26 September 2025 |
18.23 (-5%) |
19.19 |
18.20 - 19.24 |
0.6857 times |
Fri 19 September 2025 |
19.19 (4.98%) |
18.55 |
18.00 - 19.24 |
1.9244 times |
Fri 12 September 2025 |
18.28 (-5.19%) |
19.28 |
18.11 - 19.39 |
1.7897 times |
Fri 05 September 2025 |
19.28 (0.68%) |
19.15 |
19.10 - 19.60 |
0.5731 times |
Fri 29 August 2025 |
19.15 (0%) |
19.23 |
19.11 - 19.40 |
0.2577 times |
Fri 29 August 2025 |
19.15 (-2.99%) |
19.71 |
19.11 - 19.71 |
0.7871 times |
Fri 22 August 2025 |
19.74 (4.33%) |
18.90 |
18.90 - 19.75 |
0.8723 times |

Monthly price and charts BrighthouseFinancial Strong monthly Stock price targets for BrighthouseFinancial BHFAL are 17.92 and 19.35 | Monthly Target 1 | 16.8 | | Monthly Target 2 | 17.61 | | Monthly Target 3 | 18.226666666667 | | Monthly Target 4 | 19.04 | | Monthly Target 5 | 19.66 |
Monthly price and volumes Brighthouse Financial
| Date |
Closing |
Open |
Range |
Volume |
Mon 20 October 2025 |
18.43 (1.82%) |
18.00 |
17.41 - 18.84 |
0.6562 times |
Tue 30 September 2025 |
18.10 (-5.48%) |
19.15 |
18.00 - 19.60 |
1.0686 times |
Fri 29 August 2025 |
19.15 (3.29%) |
18.54 |
18.48 - 19.75 |
0.8554 times |
Thu 31 July 2025 |
18.54 (-2.83%) |
19.21 |
17.73 - 19.65 |
2.9288 times |
Mon 30 June 2025 |
19.08 (-6.7%) |
20.44 |
19.02 - 21.08 |
0.6987 times |
Fri 30 May 2025 |
20.45 (1.54%) |
20.09 |
19.60 - 20.90 |
0.5425 times |
Wed 30 April 2025 |
20.14 (-4.23%) |
21.11 |
19.27 - 21.31 |
0.5928 times |
Mon 31 March 2025 |
21.03 (-0.66%) |
21.18 |
21.02 - 22.18 |
0.8905 times |
Fri 28 February 2025 |
21.17 (-0.19%) |
21.28 |
20.65 - 22.51 |
0.7325 times |
Fri 31 January 2025 |
21.21 (-9.9%) |
23.56 |
21.21 - 24.39 |
1.034 times |
Tue 31 December 2024 |
23.54 (-4%) |
24.58 |
23.06 - 24.82 |
0.618 times |

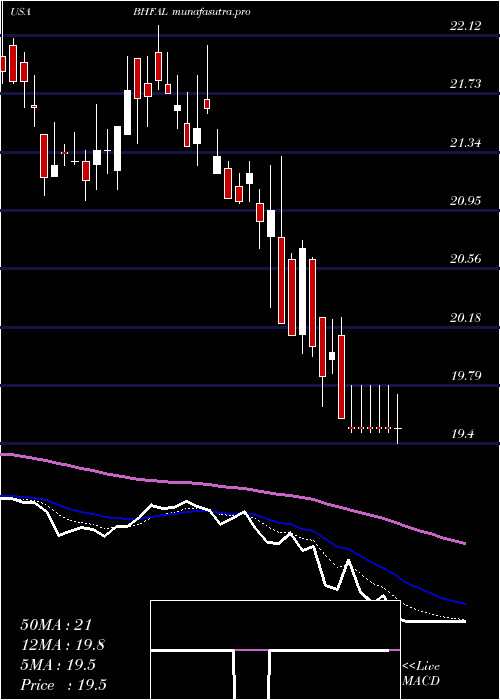
DMA SMA EMA moving averages of Brighthouse Financial BHFAL
DMA (daily moving average) of Brighthouse Financial BHFAL
| DMA period | DMA value | | 5 day DMA | 18.25 | | 12 day DMA | 18 | | 20 day DMA | 18.14 | | 35 day DMA | 18.44 | | 50 day DMA | 18.7 | | 100 day DMA | 19.07 | | 150 day DMA | 19.48 | | 200 day DMA | 20.18 | EMA (exponential moving average) of Brighthouse Financial BHFAL
| EMA period | EMA current | EMA prev | EMA prev2 | | 5 day EMA | 18.3 | 18.23 | 18.05 | | 12 day EMA | 18.17 | 18.12 | 18.03 | | 20 day EMA | 18.2 | 18.18 | 18.14 | | 35 day EMA | 18.39 | 18.39 | 18.38 | | 50 day EMA | 18.67 | 18.68 | 18.68 |
SMA (simple moving average) of Brighthouse Financial BHFAL
| SMA period | SMA current | SMA prev | SMA prev2 | | 5 day SMA | 18.25 | 18.06 | 17.84 | | 12 day SMA | 18 | 17.98 | 17.95 | | 20 day SMA | 18.14 | 18.17 | 18.2 | | 35 day SMA | 18.44 | 18.46 | 18.48 | | 50 day SMA | 18.7 | 18.71 | 18.71 | | 100 day SMA | 19.07 | 19.09 | 19.1 | | 150 day SMA | 19.48 | 19.51 | 19.53 | | 200 day SMA | 20.18 | 20.2 | 20.23 |
|
|
