BrighthouseFinancial BHF full analysis,charts,indicators,moving averages,SMA,DMA,EMA,ADX,MACD,RSIBrighthouse Financial BHF WideScreen charts, DMA,SMA,EMA technical analysis, forecast prediction, by indicators ADX,MACD,RSI,CCI USA stock exchange
operates under Finance sector & deals in Life Insurance
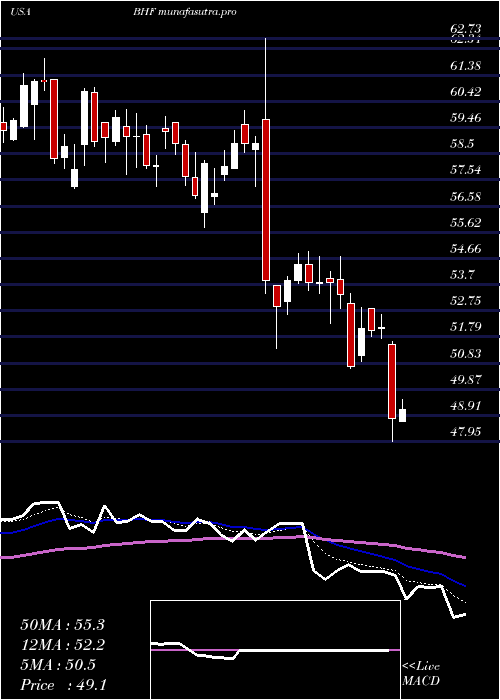
Daily price and charts and targets BrighthouseFinancial Strong Daily Stock price targets for BrighthouseFinancial BHF are 65.49 and 65.64 | Daily Target 1 | 65.37 | | Daily Target 2 | 65.45 | | Daily Target 3 | 65.523333333333 | | Daily Target 4 | 65.6 | | Daily Target 5 | 65.67 |
Daily price and volume Brighthouse Financial
| Date |
Closing |
Open |
Range |
Volume |
Thu 04 December 2025 |
65.52 (-0.11%) |
65.51 |
65.45 - 65.60 |
0.6703 times |
Wed 03 December 2025 |
65.59 (0.08%) |
65.54 |
65.32 - 65.61 |
0.7329 times |
Tue 02 December 2025 |
65.54 (-0.06%) |
65.63 |
65.38 - 65.63 |
1.0852 times |
Mon 01 December 2025 |
65.58 (0.05%) |
65.49 |
65.41 - 65.64 |
0.8539 times |
Fri 28 November 2025 |
65.55 (0.21%) |
65.50 |
65.41 - 65.65 |
0.3282 times |
Wed 26 November 2025 |
65.41 (-0.26%) |
65.67 |
65.00 - 65.68 |
1.3906 times |
Tue 25 November 2025 |
65.58 (0.09%) |
65.67 |
65.52 - 65.72 |
1.0482 times |
Mon 24 November 2025 |
65.52 (-0.08%) |
65.58 |
65.45 - 65.67 |
1.2978 times |
Fri 21 November 2025 |
65.57 (0.06%) |
65.55 |
65.42 - 65.72 |
1.0322 times |
Thu 20 November 2025 |
65.53 (-0.21%) |
65.74 |
65.14 - 65.75 |
1.5607 times |
Wed 19 November 2025 |
65.67 (-0.17%) |
65.76 |
65.56 - 65.90 |
1.2034 times |
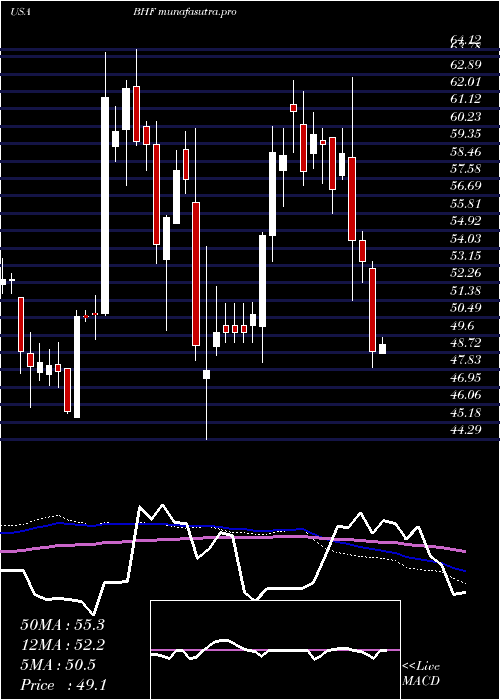
Weekly price and charts BrighthouseFinancial Strong weekly Stock price targets for BrighthouseFinancial BHF are 65.42 and 65.74 | Weekly Target 1 | 65.17 | | Weekly Target 2 | 65.35 | | Weekly Target 3 | 65.493333333333 | | Weekly Target 4 | 65.67 | | Weekly Target 5 | 65.81 |
Weekly price and volumes for Brighthouse Financial
| Date |
Closing |
Open |
Range |
Volume |
Thu 04 December 2025 |
65.52 (-0.05%) |
65.49 |
65.32 - 65.64 |
0.4504 times |
Fri 28 November 2025 |
65.55 (-0.03%) |
65.58 |
65.00 - 65.72 |
0.5477 times |
Fri 21 November 2025 |
65.57 (-0.32%) |
65.81 |
65.14 - 65.92 |
0.9236 times |
Fri 14 November 2025 |
65.78 (-0.35%) |
65.98 |
65.60 - 66.33 |
1.3284 times |
Fri 07 November 2025 |
66.01 (15.66%) |
52.95 |
51.60 - 66.09 |
2.8872 times |
Fri 31 October 2025 |
57.07 (0%) |
56.25 |
54.01 - 58.58 |
0.6048 times |
Fri 31 October 2025 |
57.07 (22.36%) |
46.69 |
45.67 - 58.58 |
0.8721 times |
Fri 24 October 2025 |
46.64 (0.21%) |
46.51 |
45.93 - 48.08 |
0.4723 times |
Fri 17 October 2025 |
46.54 (-1.57%) |
47.91 |
44.51 - 50.53 |
1.337 times |
Fri 10 October 2025 |
47.28 (-10.93%) |
52.86 |
47.23 - 53.31 |
0.5764 times |
Fri 03 October 2025 |
53.08 (-4.77%) |
55.50 |
51.47 - 56.00 |
0.7051 times |
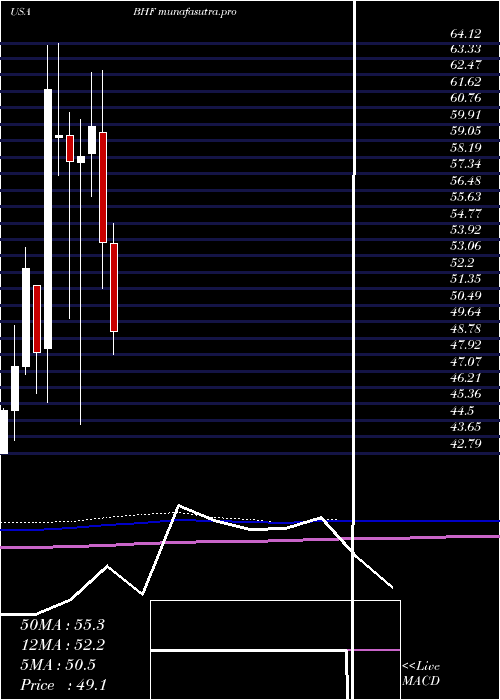
Monthly price and charts BrighthouseFinancial Strong monthly Stock price targets for BrighthouseFinancial BHF are 65.42 and 65.74 | Monthly Target 1 | 65.17 | | Monthly Target 2 | 65.35 | | Monthly Target 3 | 65.493333333333 | | Monthly Target 4 | 65.67 | | Monthly Target 5 | 65.81 |
Monthly price and volumes Brighthouse Financial
| Date |
Closing |
Open |
Range |
Volume |
Thu 04 December 2025 |
65.52 (-0.05%) |
65.49 |
65.32 - 65.64 |
0.149 times |
Fri 28 November 2025 |
65.55 (14.86%) |
52.95 |
51.60 - 66.33 |
1.8815 times |
Fri 31 October 2025 |
57.07 (7.52%) |
52.69 |
44.51 - 58.58 |
1.4069 times |
Tue 30 September 2025 |
53.08 (12.31%) |
46.60 |
42.07 - 60.74 |
1.7179 times |
Fri 29 August 2025 |
47.26 (-1.23%) |
47.00 |
43.16 - 48.34 |
0.6236 times |
Thu 31 July 2025 |
47.85 (-11.01%) |
53.73 |
46.50 - 54.75 |
0.9507 times |
Mon 30 June 2025 |
53.77 (-10.1%) |
59.51 |
51.35 - 62.73 |
0.7207 times |
Fri 30 May 2025 |
59.81 (2.73%) |
58.41 |
56.13 - 62.58 |
0.8218 times |
Wed 30 April 2025 |
58.22 (0.4%) |
57.93 |
44.29 - 60.14 |
1.101 times |
Mon 31 March 2025 |
57.99 (-2.23%) |
59.33 |
49.82 - 60.50 |
0.6268 times |
Fri 28 February 2025 |
59.31 (-3.89%) |
59.20 |
57.24 - 64.12 |
0.8073 times |
DMA SMA EMA moving averages of Brighthouse Financial BHF
DMA (daily moving average) of Brighthouse Financial BHF
| DMA period | DMA value | | 5 day DMA | 65.56 | | 12 day DMA | 65.57 | | 20 day DMA | 65.67 | | 35 day DMA | 58.4 | | 50 day DMA | 56.22 | | 100 day DMA | 52.04 | | 150 day DMA | 53.64 | | 200 day DMA | 53.89 | EMA (exponential moving average) of Brighthouse Financial BHF
| EMA period | EMA current | EMA prev | EMA prev2 | | 5 day EMA | 65.55 | 65.56 | 65.54 | | 12 day EMA | 65.05 | 64.96 | 64.85 | | 20 day EMA | 63.55 | 63.34 | 63.1 | | 35 day EMA | 60.77 | 60.49 | 60.19 | | 50 day EMA | 56.89 | 56.54 | 56.17 |
SMA (simple moving average) of Brighthouse Financial BHF
| SMA period | SMA current | SMA prev | SMA prev2 | | 5 day SMA | 65.56 | 65.53 | 65.53 | | 12 day SMA | 65.57 | 65.58 | 65.59 | | 20 day SMA | 65.67 | 64.98 | 64.41 | | 35 day SMA | 58.4 | 57.91 | 57.46 | | 50 day SMA | 56.22 | 55.99 | 55.75 | | 100 day SMA | 52.04 | 51.86 | 51.69 | | 150 day SMA | 53.64 | 53.59 | 53.53 | | 200 day SMA | 53.89 | 53.88 | 53.86 |
|
|
