Bunge BG full analysis,charts,indicators,moving averages,SMA,DMA,EMA,ADX,MACD,RSIBunge BG WideScreen charts, DMA,SMA,EMA technical analysis, forecast prediction, by indicators ADX,MACD,RSI,CCI USA stock exchange
operates under Consumer Non Durables sector & deals in Packaged Foods
Daily price and charts and targets Bunge Strong Daily Stock price targets for Bunge BG are 91.6 and 95.19 | Daily Target 1 | 90.67 | | Daily Target 2 | 92.53 | | Daily Target 3 | 94.26 | | Daily Target 4 | 96.12 | | Daily Target 5 | 97.85 |
Daily price and volume Bunge
| Date |
Closing |
Open |
Range |
Volume |
Thu 04 December 2025 |
94.39 (-0.94%) |
95.75 |
92.40 - 95.99 |
0.8367 times |
Wed 03 December 2025 |
95.29 (-0.79%) |
96.70 |
95.14 - 97.35 |
0.7983 times |
Tue 02 December 2025 |
96.05 (-0.38%) |
97.12 |
95.58 - 97.25 |
1.0876 times |
Mon 01 December 2025 |
96.42 (0.36%) |
96.40 |
95.53 - 97.40 |
1.1418 times |
Fri 28 November 2025 |
96.07 (-0.42%) |
96.47 |
95.99 - 97.09 |
0.3971 times |
Wed 26 November 2025 |
96.48 (-0.03%) |
96.52 |
96.04 - 97.31 |
0.8612 times |
Tue 25 November 2025 |
96.51 (3.21%) |
93.63 |
93.31 - 96.51 |
1.1129 times |
Mon 24 November 2025 |
93.51 (-1.13%) |
94.50 |
93.48 - 94.91 |
1.286 times |
Fri 21 November 2025 |
94.58 (1.92%) |
92.91 |
92.56 - 95.33 |
1.0592 times |
Thu 20 November 2025 |
92.80 (-0.38%) |
93.46 |
92.70 - 94.61 |
1.4192 times |
Wed 19 November 2025 |
93.15 (-3.11%) |
96.28 |
91.09 - 96.73 |
2.0147 times |
Weekly price and charts Bunge Strong weekly Stock price targets for Bunge BG are 90.9 and 95.9 | Weekly Target 1 | 89.73 | | Weekly Target 2 | 92.06 | | Weekly Target 3 | 94.73 | | Weekly Target 4 | 97.06 | | Weekly Target 5 | 99.73 |
Weekly price and volumes for Bunge
| Date |
Closing |
Open |
Range |
Volume |
Thu 04 December 2025 |
94.39 (-1.75%) |
96.40 |
92.40 - 97.40 |
0.7196 times |
Fri 28 November 2025 |
96.07 (1.58%) |
94.50 |
93.31 - 97.31 |
0.681 times |
Fri 21 November 2025 |
94.58 (-1.49%) |
95.09 |
91.09 - 96.73 |
1.2401 times |
Fri 14 November 2025 |
96.01 (1.36%) |
95.72 |
93.55 - 98.39 |
0.9426 times |
Fri 07 November 2025 |
94.72 (0.13%) |
92.82 |
91.60 - 98.68 |
1.282 times |
Fri 31 October 2025 |
94.60 (0%) |
94.56 |
93.76 - 95.37 |
0.1598 times |
Fri 31 October 2025 |
94.60 (-3.3%) |
99.47 |
93.76 - 99.55 |
0.8465 times |
Fri 24 October 2025 |
97.83 (0.34%) |
98.00 |
93.28 - 99.41 |
0.9491 times |
Fri 17 October 2025 |
97.50 (20.71%) |
80.60 |
79.12 - 98.23 |
2.2295 times |
Fri 10 October 2025 |
80.77 (-3.81%) |
83.96 |
80.70 - 85.42 |
0.9497 times |
Fri 03 October 2025 |
83.97 (2.44%) |
82.16 |
80.12 - 84.15 |
1.0382 times |
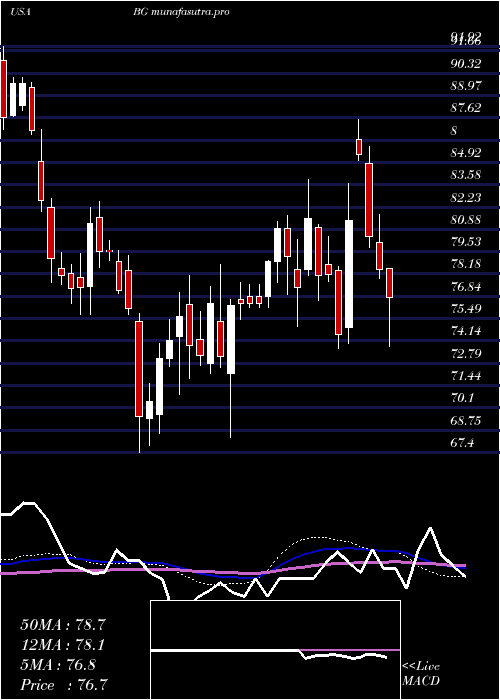
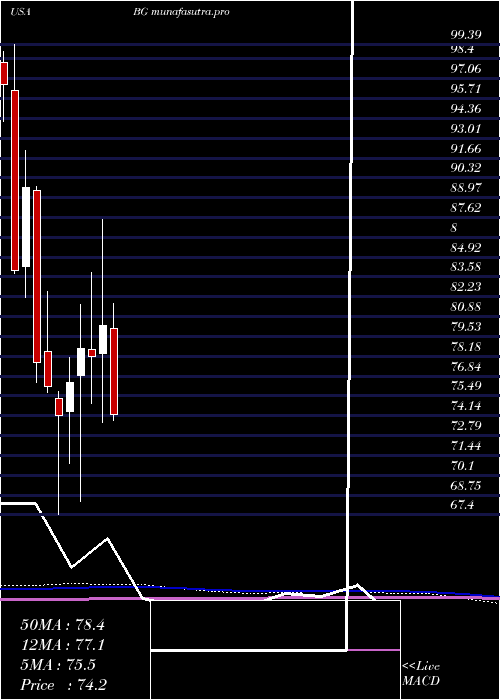
Monthly price and charts Bunge Strong monthly Stock price targets for Bunge BG are 90.9 and 95.9 | Monthly Target 1 | 89.73 | | Monthly Target 2 | 92.06 | | Monthly Target 3 | 94.73 | | Monthly Target 4 | 97.06 | | Monthly Target 5 | 99.73 |
Monthly price and volumes Bunge
| Date |
Closing |
Open |
Range |
Volume |
Thu 04 December 2025 |
94.39 (-1.75%) |
96.40 |
92.40 - 97.40 |
0.1432 times |
Fri 28 November 2025 |
96.07 (1.55%) |
92.82 |
91.09 - 98.68 |
0.8249 times |
Fri 31 October 2025 |
94.60 (16.43%) |
81.57 |
79.12 - 99.55 |
1.1284 times |
Tue 30 September 2025 |
81.25 (-3.53%) |
83.62 |
76.01 - 85.31 |
1.2563 times |
Fri 29 August 2025 |
84.22 (5.59%) |
79.80 |
77.25 - 88.51 |
1.1725 times |
Thu 31 July 2025 |
79.76 (-0.65%) |
80.04 |
71.60 - 81.75 |
1.2553 times |
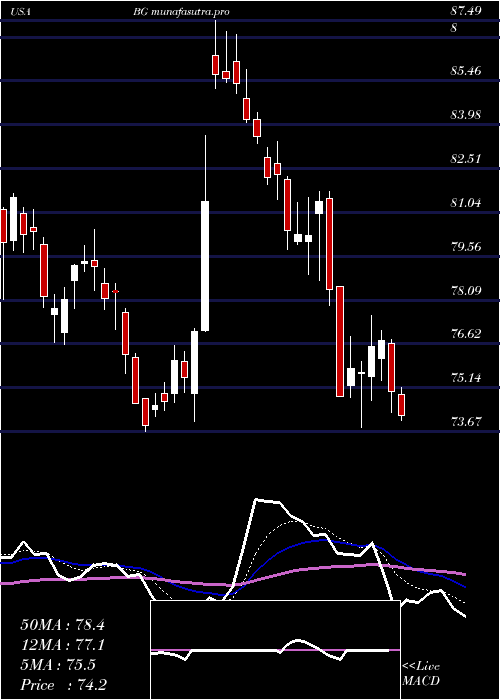
Mon 30 June 2025 |
80.28 (2.73%) |
78.39 |
73.67 - 87.49 |
1.0043 times |
Fri 30 May 2025 |
78.15 (-0.72%) |
78.64 |
75.00 - 83.88 |
1.2028 times |
Wed 30 April 2025 |
78.72 (3.01%) |
76.87 |
68.33 - 81.72 |
0.9419 times |
Mon 31 March 2025 |
76.42 (3.01%) |
74.40 |
70.89 - 78.07 |
1.0703 times |
Fri 28 February 2025 |
74.19 (-2.55%) |
75.30 |
67.40 - 75.78 |
1.0343 times |
DMA SMA EMA moving averages of Bunge BG
DMA (daily moving average) of Bunge BG
| DMA period | DMA value | | 5 day DMA | 95.64 | | 12 day DMA | 95.12 | | 20 day DMA | 95.28 | | 35 day DMA | 95.52 | | 50 day DMA | 91.73 | | 100 day DMA | 86.26 | | 150 day DMA | 83.78 | | 200 day DMA | 81.65 | EMA (exponential moving average) of Bunge BG
| EMA period | EMA current | EMA prev | EMA prev2 | | 5 day EMA | 95.28 | 95.72 | 95.94 | | 12 day EMA | 95.3 | 95.47 | 95.5 | | 20 day EMA | 94.93 | 94.99 | 94.96 | | 35 day EMA | 92.92 | 92.83 | 92.69 | | 50 day EMA | 91.06 | 90.92 | 90.74 |
SMA (simple moving average) of Bunge BG
| SMA period | SMA current | SMA prev | SMA prev2 | | 5 day SMA | 95.64 | 96.06 | 96.31 | | 12 day SMA | 95.12 | 95.08 | 95.14 | | 20 day SMA | 95.28 | 95.34 | 95.27 | | 35 day SMA | 95.52 | 95.48 | 95.11 | | 50 day SMA | 91.73 | 91.43 | 91.09 | | 100 day SMA | 86.26 | 86.06 | 85.86 | | 150 day SMA | 83.78 | 83.68 | 83.58 | | 200 day SMA | 81.65 | 81.52 | 81.4 |
|
|
