BrightHorizons BFAM full analysis,charts,indicators,moving averages,SMA,DMA,EMA,ADX,MACD,RSIBright Horizons BFAM WideScreen charts, DMA,SMA,EMA technical analysis, forecast prediction, by indicators ADX,MACD,RSI,CCI USA stock exchange
operates under Miscellaneous sector & deals in Other Consumer Services
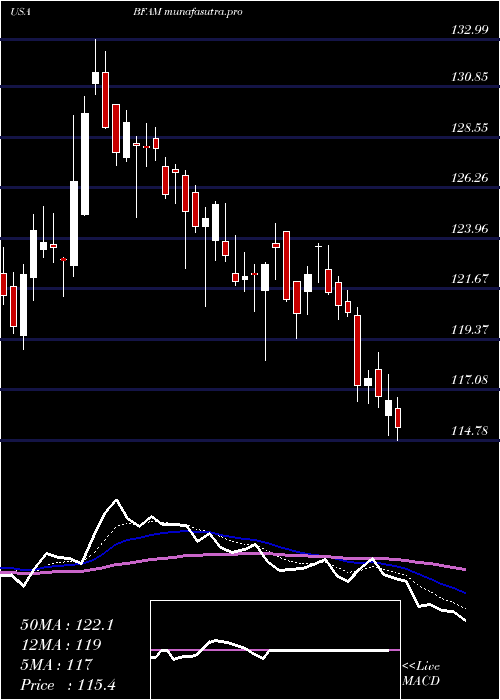
Daily price and charts and targets BrightHorizons Strong Daily Stock price targets for BrightHorizons BFAM are 102.76 and 104.87 | Daily Target 1 | 102.35 | | Daily Target 2 | 103.17 | | Daily Target 3 | 104.46 | | Daily Target 4 | 105.28 | | Daily Target 5 | 106.57 |
Daily price and volume Bright Horizons
| Date |
Closing |
Open |
Range |
Volume |
Thu 04 December 2025 |
103.99 (-0.26%) |
104.49 |
103.64 - 105.75 |
1.1696 times |
Wed 03 December 2025 |
104.26 (0.21%) |
103.87 |
103.67 - 105.32 |
0.8873 times |
Tue 02 December 2025 |
104.04 (0.33%) |
104.21 |
102.62 - 104.97 |
0.7945 times |
Mon 01 December 2025 |
103.70 (0.91%) |
102.36 |
101.07 - 104.43 |
1.0717 times |
Fri 28 November 2025 |
102.76 (0.29%) |
102.32 |
102.31 - 104.10 |
0.3855 times |
Wed 26 November 2025 |
102.46 (0.52%) |
101.39 |
100.96 - 103.10 |
0.7112 times |
Tue 25 November 2025 |
101.93 (3.04%) |
98.85 |
98.85 - 102.69 |
1.0099 times |
Mon 24 November 2025 |
98.92 (-2.18%) |
100.18 |
98.59 - 100.67 |
1.1455 times |
Fri 21 November 2025 |
101.12 (3.62%) |
98.02 |
97.95 - 101.65 |
1.5015 times |
Thu 20 November 2025 |
97.59 (-2.01%) |
99.37 |
97.47 - 101.00 |
1.3234 times |
Wed 19 November 2025 |
99.59 (-0.1%) |
99.15 |
98.35 - 99.94 |
0.9155 times |
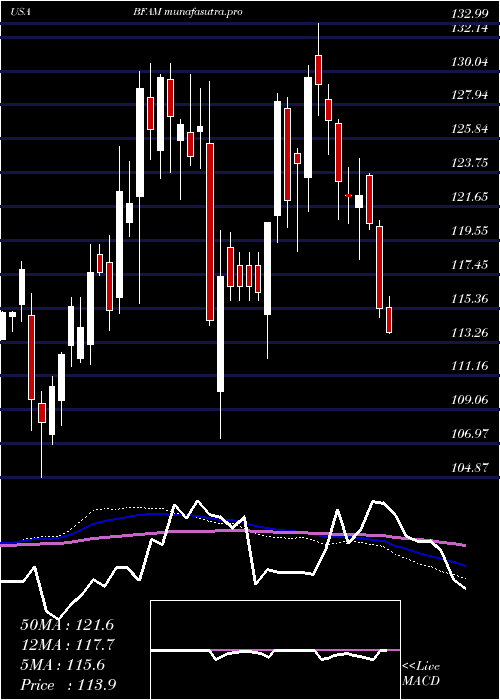
Weekly price and charts BrightHorizons Strong weekly Stock price targets for BrightHorizons BFAM are 102.53 and 107.21 | Weekly Target 1 | 98.92 | | Weekly Target 2 | 101.46 | | Weekly Target 3 | 103.60333333333 | | Weekly Target 4 | 106.14 | | Weekly Target 5 | 108.28 |
Weekly price and volumes for Bright Horizons
| Date |
Closing |
Open |
Range |
Volume |
Thu 04 December 2025 |
103.99 (1.2%) |
102.36 |
101.07 - 105.75 |
0.7584 times |
Fri 28 November 2025 |
102.76 (1.62%) |
100.18 |
98.59 - 104.10 |
0.6287 times |
Fri 21 November 2025 |
101.12 (1.66%) |
99.22 |
95.70 - 101.65 |
1.367 times |
Fri 14 November 2025 |
99.47 (1.03%) |
98.27 |
97.21 - 101.94 |
0.7646 times |
Fri 07 November 2025 |
98.46 (-9.86%) |
104.22 |
95.87 - 105.79 |
0.8273 times |
Fri 31 October 2025 |
109.23 (0%) |
100.07 |
100.07 - 109.86 |
0.9039 times |
Fri 31 October 2025 |
109.23 (8.27%) |
101.69 |
91.49 - 109.86 |
2.2231 times |
Fri 24 October 2025 |
100.89 (0.34%) |
100.03 |
100.03 - 104.11 |
0.7507 times |
Fri 17 October 2025 |
100.55 (3.04%) |
96.89 |
96.06 - 101.41 |
0.817 times |
Fri 10 October 2025 |
97.58 (-8.32%) |
107.27 |
95.53 - 107.27 |
0.9594 times |
Fri 03 October 2025 |
106.43 (-1.93%) |
108.54 |
105.68 - 109.36 |
0.5557 times |
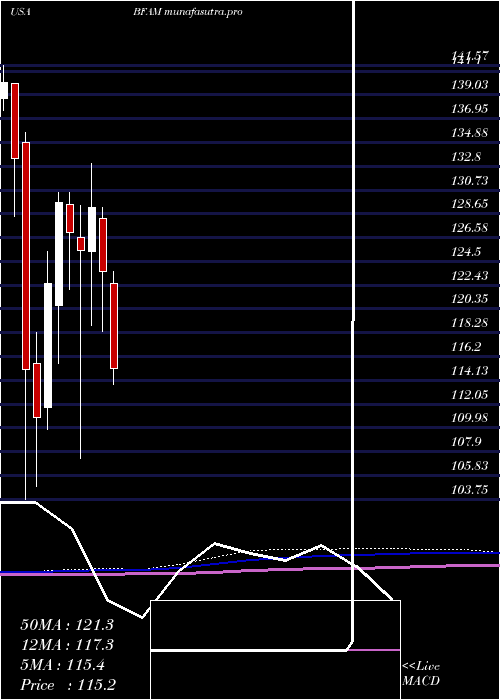
Monthly price and charts BrightHorizons Strong monthly Stock price targets for BrightHorizons BFAM are 102.53 and 107.21 | Monthly Target 1 | 98.92 | | Monthly Target 2 | 101.46 | | Monthly Target 3 | 103.60333333333 | | Monthly Target 4 | 106.14 | | Monthly Target 5 | 108.28 |
Monthly price and volumes Bright Horizons
| Date |
Closing |
Open |
Range |
Volume |
Thu 04 December 2025 |
103.99 (1.2%) |
102.36 |
101.07 - 105.75 |
0.2459 times |
Fri 28 November 2025 |
102.76 (-5.92%) |
104.22 |
95.70 - 105.79 |
1.1634 times |
Fri 31 October 2025 |
109.23 (0.61%) |
108.52 |
91.49 - 109.86 |
1.9282 times |
Tue 30 September 2025 |
108.57 (-8.02%) |
116.49 |
106.04 - 117.30 |
1.1505 times |
Fri 29 August 2025 |
118.04 (4.37%) |
127.37 |
116.72 - 130.76 |
1.1867 times |
Thu 31 July 2025 |
113.10 (-8.49%) |
122.56 |
110.97 - 123.63 |
0.9934 times |
Mon 30 June 2025 |
123.59 (-4.34%) |
128.25 |
118.39 - 129.18 |
0.832 times |
Fri 30 May 2025 |
129.20 (3.01%) |
125.36 |
118.89 - 132.99 |
1.0001 times |
Wed 30 April 2025 |
125.42 (-1.28%) |
126.54 |
107.30 - 129.38 |
0.8362 times |
Mon 31 March 2025 |
127.04 (-2.02%) |
129.49 |
122.08 - 130.48 |
0.6636 times |
Fri 28 February 2025 |
129.66 (5.76%) |
120.68 |
115.63 - 130.51 |
0.8296 times |
DMA SMA EMA moving averages of Bright Horizons BFAM
DMA (daily moving average) of Bright Horizons BFAM
| DMA period | DMA value | | 5 day DMA | 103.75 | | 12 day DMA | 101.67 | | 20 day DMA | 100.62 | | 35 day DMA | 100.72 | | 50 day DMA | 101.39 | | 100 day DMA | 108.67 | | 150 day DMA | 113.51 | | 200 day DMA | 115.91 | EMA (exponential moving average) of Bright Horizons BFAM
| EMA period | EMA current | EMA prev | EMA prev2 | | 5 day EMA | 103.55 | 103.33 | 102.86 | | 12 day EMA | 102.28 | 101.97 | 101.55 | | 20 day EMA | 101.71 | 101.47 | 101.18 | | 35 day EMA | 101.76 | 101.63 | 101.48 | | 50 day EMA | 102.26 | 102.19 | 102.11 |
SMA (simple moving average) of Bright Horizons BFAM
| SMA period | SMA current | SMA prev | SMA prev2 | | 5 day SMA | 103.75 | 103.44 | 102.98 | | 12 day SMA | 101.67 | 101.03 | 100.63 | | 20 day SMA | 100.62 | 100.43 | 100.35 | | 35 day SMA | 100.72 | 100.61 | 100.44 | | 50 day SMA | 101.39 | 101.46 | 101.55 | | 100 day SMA | 108.67 | 108.76 | 108.88 | | 150 day SMA | 113.51 | 113.65 | 113.78 | | 200 day SMA | 115.91 | 116.03 | 116.15 |
|
|
