BlackrockEnhanced BDJ full analysis,charts,indicators,moving averages,SMA,DMA,EMA,ADX,MACD,RSIBlackrock Enhanced BDJ WideScreen charts, DMA,SMA,EMA technical analysis, forecast prediction, by indicators ADX,MACD,RSI,CCI USA stock exchange
operates under N A sector & deals in N A
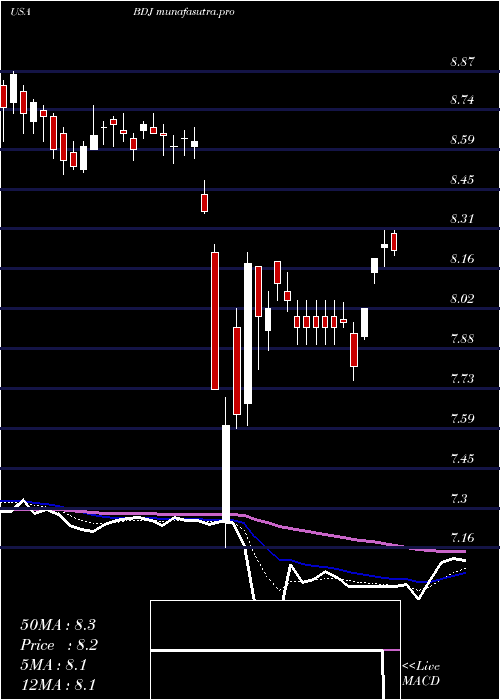
Daily price and charts and targets BlackrockEnhanced Strong Daily Stock price targets for BlackrockEnhanced BDJ are 9.14 and 9.2 | Daily Target 1 | 9.09 | | Daily Target 2 | 9.12 | | Daily Target 3 | 9.1466666666667 | | Daily Target 4 | 9.18 | | Daily Target 5 | 9.21 |
Daily price and volume Blackrock Enhanced
| Date |
Closing |
Open |
Range |
Volume |
Thu 04 December 2025 |
9.16 (0.33%) |
9.11 |
9.11 - 9.17 |
0.4515 times |
Wed 03 December 2025 |
9.13 (-0.11%) |
9.07 |
9.07 - 9.16 |
0.8315 times |
Tue 02 December 2025 |
9.14 (0.33%) |
9.12 |
9.08 - 9.15 |
1.0302 times |
Mon 01 December 2025 |
9.11 (-0.98%) |
9.14 |
9.11 - 9.23 |
1.2198 times |
Fri 28 November 2025 |
9.20 (0.88%) |
9.18 |
9.16 - 9.20 |
0.9037 times |
Wed 26 November 2025 |
9.12 (1.22%) |
9.00 |
9.00 - 9.15 |
1.1091 times |
Tue 25 November 2025 |
9.01 (1.35%) |
8.93 |
8.91 - 9.01 |
0.999 times |
Mon 24 November 2025 |
8.89 (1.02%) |
8.86 |
8.84 - 8.93 |
0.9807 times |
Fri 21 November 2025 |
8.80 (1.38%) |
8.70 |
8.70 - 8.84 |
0.9417 times |
Thu 20 November 2025 |
8.68 (-0.8%) |
8.81 |
8.68 - 8.88 |
1.5327 times |
Wed 19 November 2025 |
8.75 (-0.57%) |
8.82 |
8.75 - 8.87 |
1.1339 times |
Weekly price and charts BlackrockEnhanced Strong weekly Stock price targets for BlackrockEnhanced BDJ are 9.12 and 9.28 | Weekly Target 1 | 8.99 | | Weekly Target 2 | 9.08 | | Weekly Target 3 | 9.1533333333333 | | Weekly Target 4 | 9.24 | | Weekly Target 5 | 9.31 |
Weekly price and volumes for Blackrock Enhanced
| Date |
Closing |
Open |
Range |
Volume |
Thu 04 December 2025 |
9.16 (-0.43%) |
9.14 |
9.07 - 9.23 |
0.7979 times |
Fri 28 November 2025 |
9.20 (4.55%) |
8.86 |
8.84 - 9.20 |
0.9016 times |
Fri 21 November 2025 |
8.80 (-1.79%) |
8.94 |
8.68 - 8.99 |
1.3588 times |
Fri 14 November 2025 |
8.96 (0.22%) |
8.99 |
8.90 - 9.13 |
1.1374 times |
Fri 07 November 2025 |
8.94 (-1.87%) |
9.01 |
8.91 - 9.06 |
0.7995 times |
Fri 31 October 2025 |
9.11 (0%) |
9.12 |
9.06 - 9.13 |
0.2392 times |
Fri 31 October 2025 |
9.11 (0.22%) |
9.13 |
9.04 - 9.20 |
1.0928 times |
Fri 24 October 2025 |
9.09 (1.56%) |
9.00 |
8.95 - 9.09 |
0.9692 times |
Fri 17 October 2025 |
8.95 (0.11%) |
9.02 |
8.94 - 9.20 |
1.2601 times |
Fri 10 October 2025 |
8.94 (-1.87%) |
9.11 |
8.91 - 9.24 |
1.4435 times |
Fri 03 October 2025 |
9.11 (1.45%) |
9.01 |
9.00 - 9.15 |
1.1136 times |
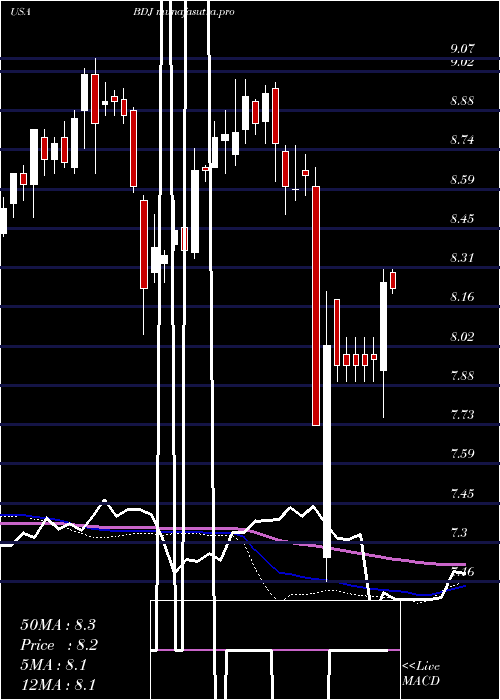
Monthly price and charts BlackrockEnhanced Strong monthly Stock price targets for BlackrockEnhanced BDJ are 9.12 and 9.28 | Monthly Target 1 | 8.99 | | Monthly Target 2 | 9.08 | | Monthly Target 3 | 9.1533333333333 | | Monthly Target 4 | 9.24 | | Monthly Target 5 | 9.31 |
Monthly price and volumes Blackrock Enhanced
| Date |
Closing |
Open |
Range |
Volume |
Thu 04 December 2025 |
9.16 (-0.43%) |
9.14 |
9.07 - 9.23 |
0.1856 times |
Fri 28 November 2025 |
9.20 (0.99%) |
9.01 |
8.68 - 9.20 |
0.9765 times |
Fri 31 October 2025 |
9.11 (0%) |
9.08 |
8.91 - 9.24 |
1.2869 times |
Tue 30 September 2025 |
9.11 (0.66%) |
9.00 |
8.93 - 9.11 |
0.9611 times |
Fri 29 August 2025 |
9.05 (2.49%) |
8.77 |
8.64 - 9.09 |
0.9979 times |
Thu 31 July 2025 |
8.83 (-0.67%) |
8.84 |
8.70 - 8.99 |
1.1707 times |
Mon 30 June 2025 |
8.89 (3.86%) |
8.57 |
8.51 - 8.89 |
0.869 times |
Fri 30 May 2025 |
8.56 (3.76%) |
8.30 |
8.21 - 8.72 |
1.0318 times |
Wed 30 April 2025 |
8.25 (-4.07%) |
8.63 |
7.16 - 8.67 |
1.464 times |
Mon 31 March 2025 |
8.60 (-3.8%) |
8.96 |
8.50 - 8.98 |
1.0564 times |
Fri 28 February 2025 |
8.94 (1.71%) |
8.72 |
8.68 - 8.99 |
0.9661 times |

DMA SMA EMA moving averages of Blackrock Enhanced BDJ
DMA (daily moving average) of Blackrock Enhanced BDJ
| DMA period | DMA value | | 5 day DMA | 9.15 | | 12 day DMA | 8.98 | | 20 day DMA | 8.99 | | 35 day DMA | 9.02 | | 50 day DMA | 9.04 | | 100 day DMA | 8.98 | | 150 day DMA | 8.87 | | 200 day DMA | 8.75 | EMA (exponential moving average) of Blackrock Enhanced BDJ
| EMA period | EMA current | EMA prev | EMA prev2 | | 5 day EMA | 9.12 | 9.1 | 9.09 | | 12 day EMA | 9.05 | 9.03 | 9.01 | | 20 day EMA | 9.03 | 9.02 | 9.01 | | 35 day EMA | 9.03 | 9.02 | 9.01 | | 50 day EMA | 9.04 | 9.03 | 9.03 |
SMA (simple moving average) of Blackrock Enhanced BDJ
| SMA period | SMA current | SMA prev | SMA prev2 | | 5 day SMA | 9.15 | 9.14 | 9.12 | | 12 day SMA | 8.98 | 8.96 | 8.95 | | 20 day SMA | 8.99 | 8.98 | 8.98 | | 35 day SMA | 9.02 | 9.01 | 9.01 | | 50 day SMA | 9.04 | 9.03 | 9.03 | | 100 day SMA | 8.98 | 8.98 | 8.98 | | 150 day SMA | 8.87 | 8.86 | 8.86 | | 200 day SMA | 8.75 | 8.75 | 8.75 |
|
|
