BeldenInc BDC full analysis,charts,indicators,moving averages,SMA,DMA,EMA,ADX,MACD,RSIBelden Inc BDC WideScreen charts, DMA,SMA,EMA technical analysis, forecast prediction, by indicators ADX,MACD,RSI,CCI USA stock exchange
operates under Basic Industries sector & deals in Telecommunications Equipment
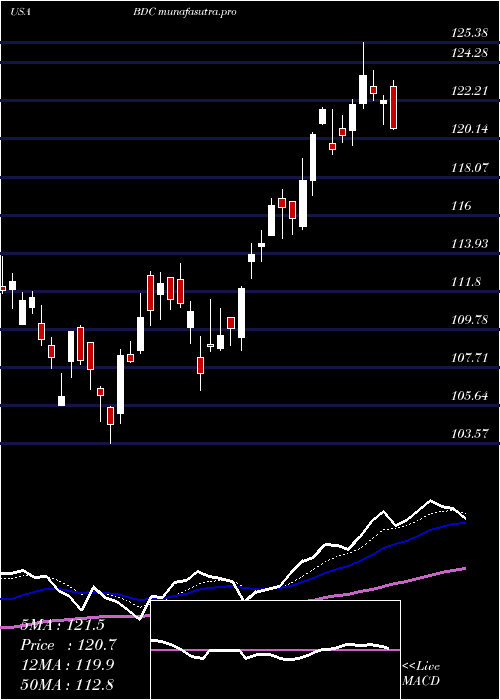
Daily price and charts and targets BeldenInc Strong Daily Stock price targets for BeldenInc BDC are 120.99 and 123.31 | Daily Target 1 | 119.11 | | Daily Target 2 | 120.55 | | Daily Target 3 | 121.43333333333 | | Daily Target 4 | 122.87 | | Daily Target 5 | 123.75 |
Daily price and volume Belden Inc
| Date |
Closing |
Open |
Range |
Volume |
Fri 05 December 2025 |
121.98 (1.18%) |
120.00 |
120.00 - 122.32 |
0.9245 times |
Thu 04 December 2025 |
120.56 (0.38%) |
119.63 |
119.63 - 121.76 |
1.0501 times |
Wed 03 December 2025 |
120.10 (6.3%) |
113.49 |
112.70 - 120.22 |
1.5181 times |
Tue 02 December 2025 |
112.98 (0.09%) |
114.13 |
112.19 - 114.54 |
0.6615 times |
Mon 01 December 2025 |
112.88 (-0.46%) |
112.09 |
110.78 - 114.29 |
0.706 times |
Fri 28 November 2025 |
113.40 (-0.31%) |
113.91 |
112.81 - 113.91 |
0.3226 times |
Wed 26 November 2025 |
113.75 (0.16%) |
113.17 |
112.28 - 114.98 |
0.6333 times |
Tue 25 November 2025 |
113.57 (1.28%) |
112.87 |
112.84 - 114.59 |
0.7302 times |
Mon 24 November 2025 |
112.13 (1.37%) |
110.47 |
110.00 - 112.53 |
1.4756 times |
Fri 21 November 2025 |
110.61 (4.02%) |
107.31 |
107.04 - 112.36 |
1.9781 times |
Thu 20 November 2025 |
106.34 (-2.42%) |
110.42 |
105.74 - 111.91 |
0.6106 times |
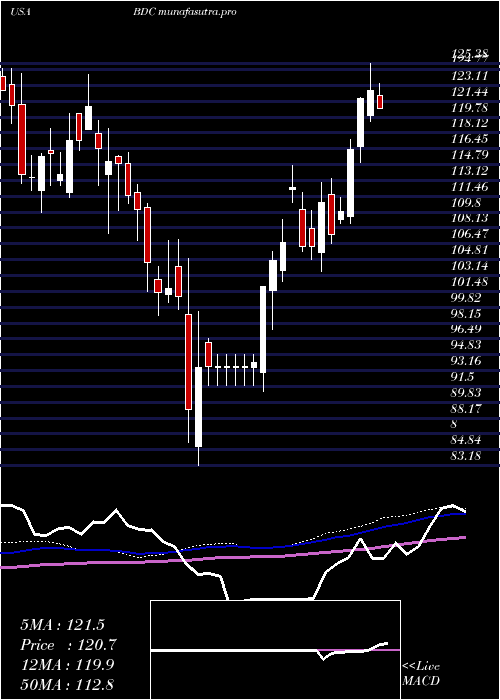
Weekly price and charts BeldenInc Strong weekly Stock price targets for BeldenInc BDC are 116.38 and 127.92 | Weekly Target 1 | 106.82 | | Weekly Target 2 | 114.4 | | Weekly Target 3 | 118.36 | | Weekly Target 4 | 125.94 | | Weekly Target 5 | 129.9 |
Weekly price and volumes for Belden Inc
| Date |
Closing |
Open |
Range |
Volume |
Fri 05 December 2025 |
121.98 (7.57%) |
112.09 |
110.78 - 122.32 |
1.0731 times |
Fri 28 November 2025 |
113.40 (2.52%) |
110.47 |
110.00 - 114.98 |
0.6981 times |
Fri 21 November 2025 |
110.61 (-1.08%) |
110.99 |
105.74 - 112.36 |
1.2925 times |
Fri 14 November 2025 |
111.82 (-6.61%) |
121.02 |
107.29 - 121.02 |
0.8928 times |
Fri 07 November 2025 |
119.74 (-1.73%) |
116.08 |
115.58 - 120.80 |
1.0697 times |
Fri 31 October 2025 |
121.85 (0%) |
122.31 |
119.44 - 123.74 |
0.3878 times |
Fri 31 October 2025 |
121.85 (3.02%) |
119.08 |
115.73 - 129.02 |
1.3984 times |
Fri 24 October 2025 |
118.28 (5.15%) |
113.39 |
113.39 - 120.37 |
0.8665 times |
Fri 17 October 2025 |
112.49 (2.47%) |
111.71 |
109.32 - 114.74 |
1.1339 times |
Fri 10 October 2025 |
109.78 (-6.97%) |
119.41 |
109.59 - 119.72 |
1.187 times |
Fri 03 October 2025 |
118.00 (-4.92%) |
124.86 |
116.70 - 124.86 |
1.1571 times |
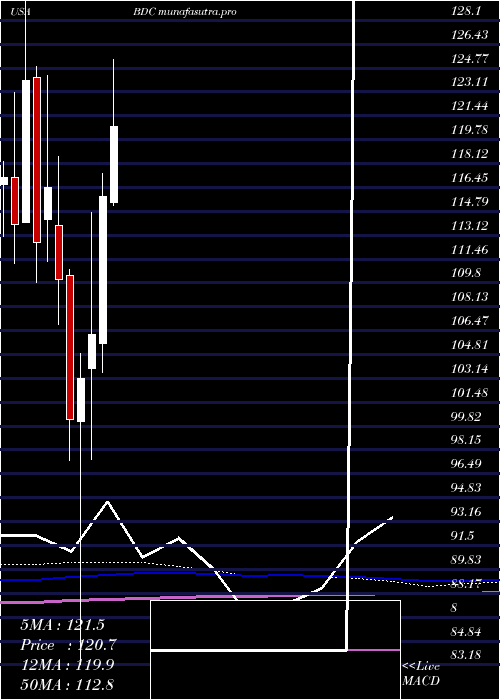
Monthly price and charts BeldenInc Strong monthly Stock price targets for BeldenInc BDC are 116.38 and 127.92 | Monthly Target 1 | 106.82 | | Monthly Target 2 | 114.4 | | Monthly Target 3 | 118.36 | | Monthly Target 4 | 125.94 | | Monthly Target 5 | 129.9 |
Monthly price and volumes Belden Inc
| Date |
Closing |
Open |
Range |
Volume |
Fri 05 December 2025 |
121.98 (7.57%) |
112.09 |
110.78 - 122.32 |
0.2295 times |
Fri 28 November 2025 |
113.40 (-6.93%) |
116.08 |
105.74 - 121.02 |
0.8453 times |
Fri 31 October 2025 |
121.85 (1.31%) |
119.08 |
109.32 - 129.02 |
1.1915 times |
Tue 30 September 2025 |
120.27 (-7.63%) |
127.45 |
119.01 - 133.77 |
1.0525 times |
Fri 29 August 2025 |
130.20 (5.3%) |
121.11 |
114.61 - 133.55 |
1.1367 times |
Thu 31 July 2025 |
123.65 (6.78%) |
115.38 |
115.22 - 132.99 |
1.2869 times |
Mon 30 June 2025 |
115.80 (9.04%) |
105.57 |
103.57 - 117.39 |
0.9787 times |
Fri 30 May 2025 |
106.20 (3%) |
103.85 |
97.47 - 114.70 |
0.9013 times |
Wed 30 April 2025 |
103.11 (2.85%) |
100.13 |
83.18 - 104.91 |
1.1367 times |
Mon 31 March 2025 |
100.25 (-8.89%) |
110.30 |
97.43 - 110.73 |
1.2408 times |
Fri 28 February 2025 |
110.03 (-5.53%) |
113.78 |
106.87 - 118.61 |
1.0849 times |
DMA SMA EMA moving averages of Belden Inc BDC
DMA (daily moving average) of Belden Inc BDC
| DMA period | DMA value | | 5 day DMA | 117.7 | | 12 day DMA | 113.94 | | 20 day DMA | 113.92 | | 35 day DMA | 115.93 | | 50 day DMA | 115.94 | | 100 day DMA | 121.63 | | 150 day DMA | 118.58 | | 200 day DMA | 113.94 | EMA (exponential moving average) of Belden Inc BDC
| EMA period | EMA current | EMA prev | EMA prev2 | | 5 day EMA | 118.67 | 117.01 | 115.23 | | 12 day EMA | 115.98 | 114.89 | 113.86 | | 20 day EMA | 115.49 | 114.81 | 114.21 | | 35 day EMA | 115.84 | 115.48 | 115.18 | | 50 day EMA | 117.22 | 117.03 | 116.89 |
SMA (simple moving average) of Belden Inc BDC
| SMA period | SMA current | SMA prev | SMA prev2 | | 5 day SMA | 117.7 | 115.98 | 114.62 | | 12 day SMA | 113.94 | 112.78 | 111.81 | | 20 day SMA | 113.92 | 113.81 | 113.79 | | 35 day SMA | 115.93 | 115.65 | 115.46 | | 50 day SMA | 115.94 | 115.99 | 116.15 | | 100 day SMA | 121.63 | 121.67 | 121.68 | | 150 day SMA | 118.58 | 118.44 | 118.32 | | 200 day SMA | 113.94 | 113.88 | 113.85 |
|
|
