BalchemCorporation BCPC full analysis,charts,indicators,moving averages,SMA,DMA,EMA,ADX,MACD,RSIBalchem Corporation BCPC WideScreen charts, DMA,SMA,EMA technical analysis, forecast prediction, by indicators ADX,MACD,RSI,CCI USA stock exchange
operates under Basic Industries sector & deals in Major Chemicals
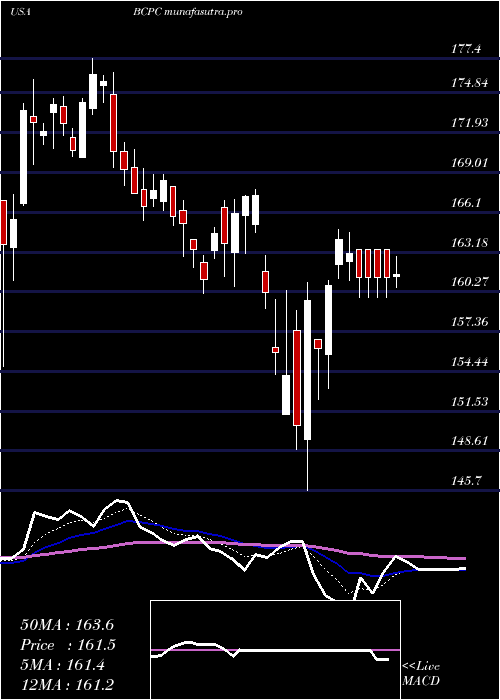
Daily price and charts and targets BalchemCorporation Strong Daily Stock price targets for BalchemCorporation BCPC are 150.85 and 154.89 | Daily Target 1 | 150.02 | | Daily Target 2 | 151.68 | | Daily Target 3 | 154.05666666667 | | Daily Target 4 | 155.72 | | Daily Target 5 | 158.1 |
Daily price and volume Balchem Corporation
| Date |
Closing |
Open |
Range |
Volume |
Thu 04 December 2025 |
153.35 (510.96%) |
153.64 |
152.39 - 156.43 |
1.3876 times |
Thu 04 December 2025 |
25.10 (-83.71%) |
25.10 |
24.86 - 25.15 |
0.1624 times |
Wed 03 December 2025 |
154.05 (515.95%) |
154.36 |
153.51 - 156.96 |
1.9836 times |
Wed 03 December 2025 |
25.01 (-83.77%) |
25.03 |
25.00 - 25.10 |
0.1803 times |
Tue 02 December 2025 |
154.10 (516.4%) |
155.74 |
153.96 - 155.79 |
1.0642 times |
Tue 02 December 2025 |
25.00 (-83.94%) |
24.64 |
24.62 - 25.00 |
0.2627 times |
Mon 01 December 2025 |
155.63 (531.62%) |
155.20 |
154.51 - 156.52 |
1.3147 times |
Mon 01 December 2025 |
24.64 (-84.23%) |
24.37 |
24.36 - 24.65 |
0.1891 times |
Fri 28 November 2025 |
156.21 (540.99%) |
155.90 |
155.79 - 156.43 |
0.5445 times |
Fri 28 November 2025 |
24.37 (-84.43%) |
24.05 |
24.03 - 24.43 |
2.9107 times |
Wed 26 November 2025 |
156.52 (552.71%) |
155.89 |
155.89 - 158.68 |
2.1418 times |
Weekly price and charts BalchemCorporation Strong weekly Stock price targets for BalchemCorporation BCPC are 150.85 and 154.89 | Weekly Target 1 | 150.02 | | Weekly Target 2 | 151.68 | | Weekly Target 3 | 154.05666666667 | | Weekly Target 4 | 155.72 | | Weekly Target 5 | 158.1 |
Weekly price and volumes for Balchem Corporation
| Date |
Closing |
Open |
Range |
Volume |
Thu 04 December 2025 |
153.35 (510.96%) |
153.64 |
152.39 - 156.43 |
0.8396 times |
Thu 04 December 2025 |
25.10 (0.36%) |
154.36 |
24.86 - 156.96 |
1.2985 times |
Wed 03 December 2025 |
25.01 (0.04%) |
155.74 |
25.00 - 155.79 |
0.753 times |
Tue 02 December 2025 |
25.00 (1.46%) |
155.20 |
24.62 - 156.52 |
0.9545 times |
Mon 01 December 2025 |
24.64 (-84.23%) |
24.37 |
24.36 - 24.65 |
0.1144 times |
Fri 28 November 2025 |
156.21 (540.99%) |
155.90 |
155.79 - 156.43 |
0.3295 times |
Fri 28 November 2025 |
24.37 (1.63%) |
155.89 |
24.03 - 158.68 |
3.0571 times |
Wed 26 November 2025 |
23.98 (1.44%) |
154.54 |
23.70 - 158.68 |
1.41 times |
Tue 25 November 2025 |
23.64 (-84.62%) |
23.60 |
23.48 - 23.79 |
0.2297 times |
Mon 24 November 2025 |
153.66 (-1.16%) |
155.88 |
153.33 - 156.13 |
1.0137 times |
Fri 21 November 2025 |
155.46 (562.1%) |
152.80 |
152.48 - 158.05 |
1.5459 times |

Monthly price and charts BalchemCorporation Strong monthly Stock price targets for BalchemCorporation BCPC are 88.86 and 221.46 | Monthly Target 1 | -21.04 | | Monthly Target 2 | 66.15 | | Monthly Target 3 | 111.55666666667 | | Monthly Target 4 | 198.75 | | Monthly Target 5 | 244.16 |
Monthly price and volumes Balchem Corporation
| Date |
Closing |
Open |
Range |
Volume |
Thu 04 December 2025 |
153.35 (-1.83%) |
24.37 |
24.36 - 156.96 |
0.2196 times |
Fri 28 November 2025 |
156.21 (1.84%) |
24.60 |
23.27 - 158.68 |
1.0629 times |
Fri 31 October 2025 |
153.39 (2.22%) |
149.07 |
24.12 - 158.85 |
1.3353 times |
Tue 30 September 2025 |
150.06 (-7.42%) |
161.30 |
147.58 - 163.10 |
0.9897 times |
Fri 29 August 2025 |
162.09 (6.31%) |
150.81 |
149.23 - 166.47 |
1.0139 times |
Thu 31 July 2025 |
152.47 (-4.23%) |
158.35 |
146.41 - 165.13 |
1.1366 times |
Mon 30 June 2025 |
159.20 (-4.5%) |
166.87 |
152.42 - 168.41 |
0.9438 times |
Fri 30 May 2025 |
166.70 (6.48%) |
156.31 |
155.26 - 171.14 |
0.9028 times |
Wed 30 April 2025 |
156.55 (-5.69%) |
165.88 |
145.70 - 167.79 |
1.3089 times |
Mon 31 March 2025 |
166.00 (-4.61%) |
173.86 |
160.12 - 177.40 |
1.0866 times |
Fri 28 February 2025 |
174.03 (8.8%) |
157.79 |
153.99 - 175.80 |
0.7804 times |

DMA SMA EMA moving averages of Balchem Corporation BCPC
DMA (daily moving average) of Balchem Corporation BCPC
| DMA period | DMA value | | 5 day DMA | 102.32 | | 12 day DMA | 89.83 | | 20 day DMA | 89.53 | | 35 day DMA | 91.53 | | 50 day DMA | 89.42 | | 100 day DMA | 105.02 | | 150 day DMA | 122.96 | | 200 day DMA | 132.96 | EMA (exponential moving average) of Balchem Corporation BCPC
| EMA period | EMA current | EMA prev | EMA prev2 | | 5 day EMA | 102.25 | 76.7 | 102.49 | | 12 day EMA | 94.67 | 84.01 | 94.72 | | 20 day EMA | 92.64 | 86.25 | 92.68 | | 35 day EMA | 91.19 | 87.53 | 91.21 | | 50 day EMA | 91.78 | 89.27 | 91.89 |
SMA (simple moving average) of Balchem Corporation BCPC
| SMA period | SMA current | SMA prev | SMA prev2 | | 5 day SMA | 102.32 | 76.65 | 102.76 | | 12 day SMA | 89.83 | 90.12 | 89.99 | | 20 day SMA | 89.53 | 89.48 | 89.41 | | 35 day SMA | 91.53 | 87.85 | 91.49 | | 50 day SMA | 89.42 | 89.43 | 89.41 | | 100 day SMA | 105.02 | 105.1 | 106.46 | | 150 day SMA | 122.96 | 122.99 | 123.89 | | 200 day SMA | 132.96 | 133.01 | 133.69 |
|
|
