BrunswickCorporation BC full analysis,charts,indicators,moving averages,SMA,DMA,EMA,ADX,MACD,RSIBrunswick Corporation BC WideScreen charts, DMA,SMA,EMA technical analysis, forecast prediction, by indicators ADX,MACD,RSI,CCI USA stock exchange
operates under Energy sector & deals in Industrial Machinery Components
Daily price and charts and targets BrunswickCorporation Strong Daily Stock price targets for BrunswickCorporation BC are 63 and 64.89 | Daily Target 1 | 61.43 | | Daily Target 2 | 62.67 | | Daily Target 3 | 63.32 | | Daily Target 4 | 64.56 | | Daily Target 5 | 65.21 |
Daily price and volume Brunswick Corporation
| Date |
Closing |
Open |
Range |
Volume |
Fri 17 October 2025 |
63.91 (2.17%) |
62.43 |
62.08 - 63.97 |
0.9005 times |
Thu 16 October 2025 |
62.55 (-0.9%) |
63.35 |
61.71 - 63.35 |
1.2975 times |
Wed 15 October 2025 |
63.12 (0.35%) |
63.59 |
62.21 - 64.02 |
1.0835 times |
Tue 14 October 2025 |
62.90 (4.38%) |
59.47 |
59.47 - 63.48 |
1.2241 times |
Mon 13 October 2025 |
60.26 (2.57%) |
59.65 |
59.50 - 61.08 |
0.8726 times |
Fri 10 October 2025 |
58.75 (-5.24%) |
61.91 |
58.56 - 62.41 |
1.3858 times |
Thu 09 October 2025 |
62.00 (-2.52%) |
63.48 |
61.98 - 63.52 |
0.8958 times |
Wed 08 October 2025 |
63.60 (0.95%) |
62.97 |
62.78 - 63.92 |
0.8319 times |
Tue 07 October 2025 |
63.00 (-2.49%) |
64.62 |
62.95 - 65.09 |
1.0975 times |
Mon 06 October 2025 |
64.61 (-2.61%) |
66.36 |
64.32 - 66.72 |
0.4106 times |
Fri 03 October 2025 |
66.34 (1.9%) |
66.00 |
65.25 - 66.90 |
1.2979 times |
Weekly price and charts BrunswickCorporation Strong weekly Stock price targets for BrunswickCorporation BC are 61.69 and 66.24 | Weekly Target 1 | 57.92 | | Weekly Target 2 | 60.91 | | Weekly Target 3 | 62.466666666667 | | Weekly Target 4 | 65.46 | | Weekly Target 5 | 67.02 |
Weekly price and volumes for Brunswick Corporation
| Date |
Closing |
Open |
Range |
Volume |
Fri 17 October 2025 |
63.91 (8.78%) |
59.65 |
59.47 - 64.02 |
1.1653 times |
Fri 10 October 2025 |
58.75 (-11.44%) |
66.36 |
58.56 - 66.72 |
1.0013 times |
Fri 03 October 2025 |
66.34 (4.29%) |
64.21 |
62.05 - 66.90 |
0.919 times |
Fri 26 September 2025 |
63.61 (0.41%) |
62.97 |
60.79 - 65.17 |
1.151 times |
Fri 19 September 2025 |
63.35 (-2.96%) |
65.58 |
62.94 - 68.07 |
1.3646 times |
Fri 12 September 2025 |
65.28 (-2%) |
67.49 |
63.68 - 67.49 |
1.1251 times |
Fri 05 September 2025 |
66.61 (4.75%) |
62.32 |
62.19 - 67.18 |
0.7133 times |
Fri 29 August 2025 |
63.59 (0%) |
64.20 |
63.23 - 64.73 |
0.1942 times |
Fri 29 August 2025 |
63.59 (-3.53%) |
65.26 |
62.95 - 65.94 |
1.1498 times |
Fri 22 August 2025 |
65.92 (4.19%) |
63.33 |
60.99 - 67.30 |
1.2163 times |
Fri 15 August 2025 |
63.27 (11.29%) |
57.08 |
55.84 - 64.96 |
1.5647 times |
Monthly price and charts BrunswickCorporation Strong monthly Stock price targets for BrunswickCorporation BC are 61.24 and 69.58 | Monthly Target 1 | 54.78 | | Monthly Target 2 | 59.35 | | Monthly Target 3 | 63.123333333333 | | Monthly Target 4 | 67.69 | | Monthly Target 5 | 71.46 |
Monthly price and volumes Brunswick Corporation
| Date |
Closing |
Open |
Range |
Volume |
Fri 17 October 2025 |
63.91 (1.06%) |
62.97 |
58.56 - 66.90 |
0.4816 times |
Tue 30 September 2025 |
63.24 (-0.55%) |
62.32 |
60.79 - 68.07 |
0.8314 times |
Fri 29 August 2025 |
63.59 (9.09%) |
57.61 |
55.60 - 67.30 |
0.9384 times |
Thu 31 July 2025 |
58.29 (5.52%) |
55.00 |
55.00 - 65.53 |
1.2381 times |
Mon 30 June 2025 |
55.24 (9.13%) |
50.28 |
48.83 - 59.13 |
1.1223 times |
Fri 30 May 2025 |
50.62 (9.92%) |
46.43 |
45.44 - 53.74 |
1.0298 times |
Wed 30 April 2025 |
46.05 (-14.48%) |
53.94 |
41.00 - 55.74 |
1.6738 times |
Mon 31 March 2025 |
53.85 (-11.5%) |
61.40 |
52.12 - 62.12 |
1.0025 times |
Fri 28 February 2025 |
60.85 (-9.77%) |
65.00 |
59.25 - 67.65 |
0.7323 times |
Fri 31 January 2025 |
67.44 (4.27%) |
65.51 |
62.64 - 73.46 |
0.9497 times |
Tue 31 December 2024 |
64.68 (-19.89%) |
79.87 |
63.08 - 79.99 |
0.6503 times |

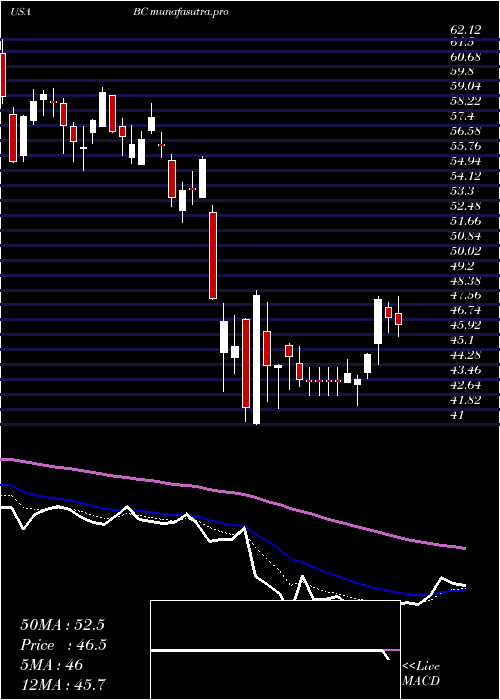
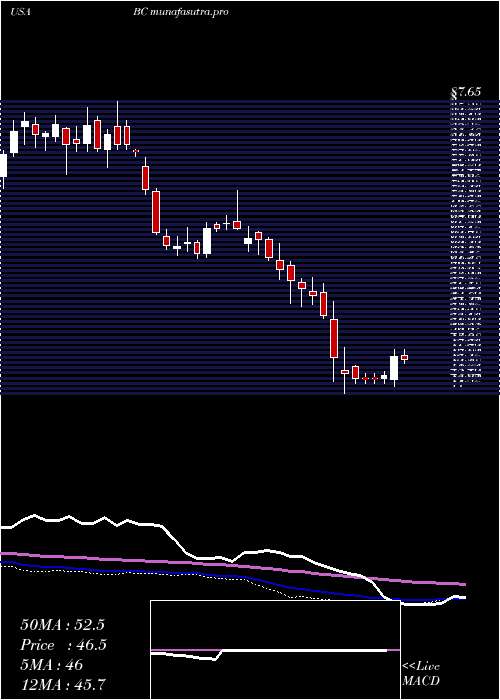
DMA SMA EMA moving averages of Brunswick Corporation BC
DMA (daily moving average) of Brunswick Corporation BC
| DMA period | DMA value | | 5 day DMA | 62.55 | | 12 day DMA | 63.01 | | 20 day DMA | 63.1 | | 35 day DMA | 63.95 | | 50 day DMA | 63.76 | | 100 day DMA | 60.54 | | 150 day DMA | 56.81 | | 200 day DMA | 58.68 | EMA (exponential moving average) of Brunswick Corporation BC
| EMA period | EMA current | EMA prev | EMA prev2 | | 5 day EMA | 62.88 | 62.36 | 62.26 | | 12 day EMA | 62.86 | 62.67 | 62.69 | | 20 day EMA | 63.09 | 63 | 63.05 | | 35 day EMA | 63.07 | 63.02 | 63.05 | | 50 day EMA | 63.15 | 63.12 | 63.14 |
SMA (simple moving average) of Brunswick Corporation BC
| SMA period | SMA current | SMA prev | SMA prev2 | | 5 day SMA | 62.55 | 61.52 | 61.41 | | 12 day SMA | 63.01 | 63.03 | 63.09 | | 20 day SMA | 63.1 | 63.07 | 63.21 | | 35 day SMA | 63.95 | 63.94 | 63.98 | | 50 day SMA | 63.76 | 63.61 | 63.51 | | 100 day SMA | 60.54 | 60.4 | 60.29 | | 150 day SMA | 56.81 | 56.76 | 56.72 | | 200 day SMA | 58.68 | 58.68 | 58.69 |
|
|
