BrookfieldBusiness BBU full analysis,charts,indicators,moving averages,SMA,DMA,EMA,ADX,MACD,RSIBrookfield Business BBU WideScreen charts, DMA,SMA,EMA technical analysis, forecast prediction, by indicators ADX,MACD,RSI,CCI USA stock exchange
operates under Basic Industries sector & deals in Engineering Construction
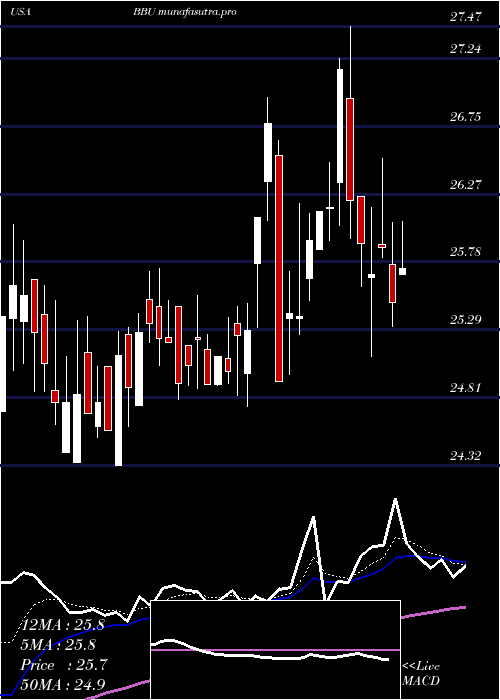
Daily price and charts and targets BrookfieldBusiness Strong Daily Stock price targets for BrookfieldBusiness BBU are 35.54 and 37.54 | Daily Target 1 | 33.97 | | Daily Target 2 | 35.11 | | Daily Target 3 | 35.97 | | Daily Target 4 | 37.11 | | Daily Target 5 | 37.97 |
Daily price and volume Brookfield Business
| Date |
Closing |
Open |
Range |
Volume |
Thu 04 December 2025 |
36.25 (3.42%) |
34.92 |
34.83 - 36.83 |
0.7654 times |
Wed 03 December 2025 |
35.05 (-1.49%) |
35.31 |
34.63 - 35.38 |
0.8294 times |
Tue 02 December 2025 |
35.58 (3.16%) |
34.31 |
34.31 - 36.19 |
0.672 times |
Mon 01 December 2025 |
34.49 (-0.92%) |
34.74 |
34.29 - 35.45 |
0.5478 times |
Fri 28 November 2025 |
34.81 (3.66%) |
33.70 |
33.30 - 35.35 |
2.4485 times |
Wed 26 November 2025 |
33.58 (0.66%) |
33.84 |
33.25 - 33.93 |
0.6246 times |
Tue 25 November 2025 |
33.36 (2.08%) |
32.68 |
32.64 - 34.39 |
0.7014 times |
Mon 24 November 2025 |
32.68 (4.98%) |
30.91 |
30.91 - 32.79 |
0.8332 times |
Fri 21 November 2025 |
31.13 (-1.42%) |
31.66 |
30.95 - 31.90 |
0.608 times |
Thu 20 November 2025 |
31.58 (-2.14%) |
32.75 |
31.42 - 33.76 |
1.9698 times |
Wed 19 November 2025 |
32.27 (1.96%) |
32.09 |
31.71 - 32.59 |
0.5811 times |
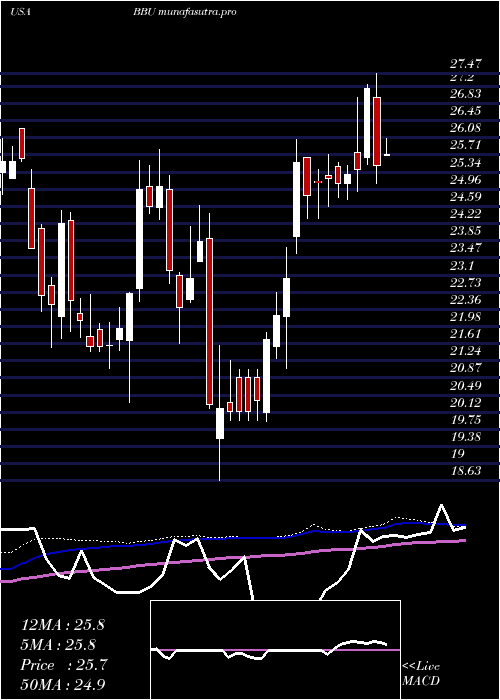
Weekly price and charts BrookfieldBusiness Strong weekly Stock price targets for BrookfieldBusiness BBU are 35.27 and 37.81 | Weekly Target 1 | 33.25 | | Weekly Target 2 | 34.75 | | Weekly Target 3 | 35.79 | | Weekly Target 4 | 37.29 | | Weekly Target 5 | 38.33 |
Weekly price and volumes for Brookfield Business
| Date |
Closing |
Open |
Range |
Volume |
Thu 04 December 2025 |
36.25 (4.14%) |
34.74 |
34.29 - 36.83 |
0.6709 times |
Fri 28 November 2025 |
34.81 (11.82%) |
30.91 |
30.91 - 35.35 |
1.0984 times |
Fri 21 November 2025 |
31.13 (-4.45%) |
32.39 |
30.85 - 33.76 |
1.1441 times |
Fri 14 November 2025 |
32.58 (4.96%) |
30.91 |
30.77 - 32.95 |
0.8259 times |
Fri 07 November 2025 |
31.04 (-12.04%) |
34.06 |
30.40 - 36.90 |
0.8274 times |
Fri 31 October 2025 |
35.29 (0%) |
34.70 |
34.36 - 35.41 |
0.1611 times |
Fri 31 October 2025 |
35.29 (0.11%) |
36.00 |
34.12 - 36.00 |
0.9498 times |
Fri 24 October 2025 |
35.25 (2%) |
35.05 |
33.35 - 35.81 |
0.688 times |
Fri 17 October 2025 |
34.56 (4.79%) |
33.80 |
33.60 - 36.72 |
1.7162 times |
Fri 10 October 2025 |
32.98 (-1.14%) |
33.01 |
32.14 - 34.94 |
1.9182 times |
Fri 03 October 2025 |
33.36 (3.6%) |
32.25 |
31.01 - 33.86 |
1.53 times |
Monthly price and charts BrookfieldBusiness Strong monthly Stock price targets for BrookfieldBusiness BBU are 35.27 and 37.81 | Monthly Target 1 | 33.25 | | Monthly Target 2 | 34.75 | | Monthly Target 3 | 35.79 | | Monthly Target 4 | 37.29 | | Monthly Target 5 | 38.33 |
Monthly price and volumes Brookfield Business
| Date |
Closing |
Open |
Range |
Volume |
Thu 04 December 2025 |
36.25 (4.14%) |
34.74 |
34.29 - 36.83 |
0.2958 times |
Fri 28 November 2025 |
34.81 (-1.36%) |
34.06 |
30.40 - 36.90 |
1.7175 times |
Fri 31 October 2025 |
35.29 (8.22%) |
32.39 |
31.01 - 36.72 |
2.7582 times |
Tue 30 September 2025 |
32.61 (21.18%) |
26.54 |
26.30 - 33.05 |
1.6688 times |
Fri 29 August 2025 |
26.91 (11.43%) |
26.00 |
23.31 - 28.28 |
0.8915 times |
Thu 31 July 2025 |
24.15 (-6.86%) |
25.87 |
24.03 - 27.47 |
0.8041 times |
Mon 30 June 2025 |
25.93 (3.27%) |
25.26 |
24.60 - 26.96 |
0.2936 times |
Fri 30 May 2025 |
25.11 (13.57%) |
22.09 |
21.07 - 26.05 |
0.7272 times |
Wed 30 April 2025 |
22.11 (-5.75%) |
23.01 |
18.63 - 24.45 |
0.4233 times |
Mon 31 March 2025 |
23.46 (-6.27%) |
24.95 |
21.62 - 25.26 |
0.4199 times |
Fri 28 February 2025 |
25.03 (14.08%) |
21.68 |
20.34 - 25.83 |
0.3992 times |
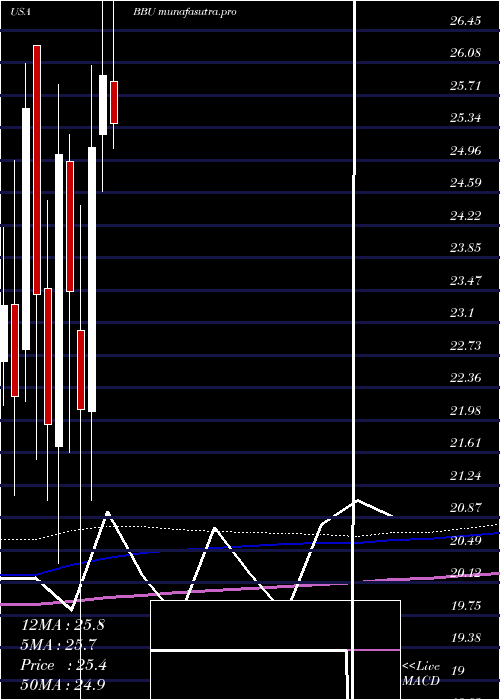
DMA SMA EMA moving averages of Brookfield Business BBU
DMA (daily moving average) of Brookfield Business BBU
| DMA period | DMA value | | 5 day DMA | 35.24 | | 12 day DMA | 33.54 | | 20 day DMA | 32.86 | | 35 day DMA | 33.72 | | 50 day DMA | 33.69 | | 100 day DMA | 30.06 | | 150 day DMA | 28.33 | | 200 day DMA | 26.89 | EMA (exponential moving average) of Brookfield Business BBU
| EMA period | EMA current | EMA prev | EMA prev2 | | 5 day EMA | 35.16 | 34.62 | 34.41 | | 12 day EMA | 34.14 | 33.76 | 33.52 | | 20 day EMA | 33.71 | 33.44 | 33.27 | | 35 day EMA | 33.31 | 33.14 | 33.03 | | 50 day EMA | 33.41 | 33.29 | 33.22 |
SMA (simple moving average) of Brookfield Business BBU
| SMA period | SMA current | SMA prev | SMA prev2 | | 5 day SMA | 35.24 | 34.7 | 34.36 | | 12 day SMA | 33.54 | 33.11 | 32.9 | | 20 day SMA | 32.86 | 32.78 | 32.74 | | 35 day SMA | 33.72 | 33.71 | 33.73 | | 50 day SMA | 33.69 | 33.53 | 33.4 | | 100 day SMA | 30.06 | 29.95 | 29.86 | | 150 day SMA | 28.33 | 28.24 | 28.15 | | 200 day SMA | 26.89 | 26.84 | 26.78 |
|
|
