BedBath BBBY full analysis,charts,indicators,moving averages,SMA,DMA,EMA,ADX,MACD,RSIBed Bath BBBY WideScreen charts, DMA,SMA,EMA technical analysis, forecast prediction, by indicators ADX,MACD,RSI,CCI USA stock exchange
operates under Consumer Services sector & deals in Home Furnishings
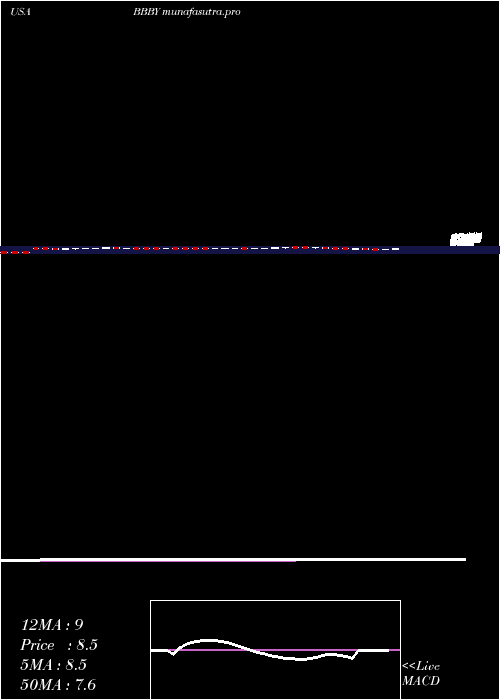
Daily price and charts and targets BedBath Strong Daily Stock price targets for BedBath BBBY are 8.22 and 9 | Daily Target 1 | 7.59 | | Daily Target 2 | 8.07 | | Daily Target 3 | 8.3733333333333 | | Daily Target 4 | 8.85 | | Daily Target 5 | 9.15 |
Daily price and volume Bed Bath
| Date |
Closing |
Open |
Range |
Volume |
Mon 20 October 2025 |
8.54 (8.51%) |
7.94 |
7.90 - 8.68 |
0.815 times |
Fri 17 October 2025 |
7.87 (-1.01%) |
7.82 |
7.79 - 8.08 |
0.9404 times |
Thu 16 October 2025 |
7.95 (-3.99%) |
8.38 |
7.84 - 8.50 |
1.1072 times |
Wed 15 October 2025 |
8.28 (-8.31%) |
9.12 |
8.23 - 9.20 |
1.1641 times |
Tue 14 October 2025 |
9.03 (4.39%) |
8.38 |
8.25 - 9.20 |
1.0249 times |
Mon 13 October 2025 |
8.65 (-1.26%) |
8.98 |
8.61 - 9.28 |
1.0916 times |
Fri 10 October 2025 |
8.76 (-13.61%) |
10.00 |
8.75 - 10.18 |
1.2552 times |
Thu 09 October 2025 |
10.14 (-8.98%) |
11.00 |
10.09 - 11.14 |
0.7474 times |
Wed 08 October 2025 |
11.14 (1%) |
10.95 |
10.61 - 11.34 |
0.6917 times |
Tue 07 October 2025 |
11.03 (-8.08%) |
12.16 |
10.89 - 12.18 |
1.1625 times |
Mon 06 October 2025 |
12.00 (-0.74%) |
12.14 |
11.42 - 12.23 |
1.0849 times |
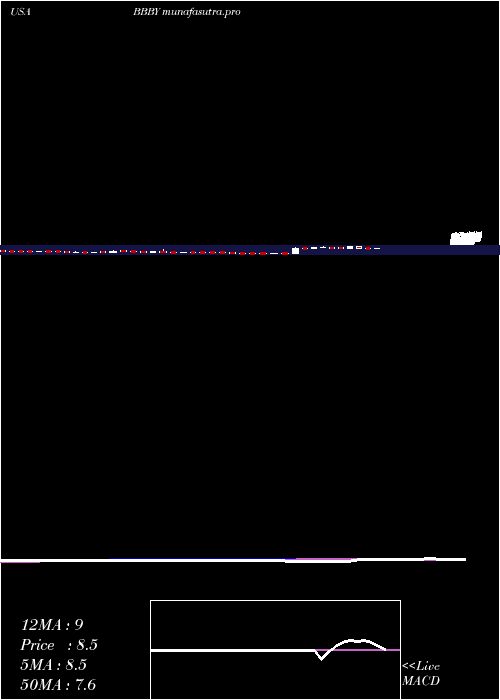
Weekly price and charts BedBath Strong weekly Stock price targets for BedBath BBBY are 8.22 and 9 | Weekly Target 1 | 7.59 | | Weekly Target 2 | 8.07 | | Weekly Target 3 | 8.3733333333333 | | Weekly Target 4 | 8.85 | | Weekly Target 5 | 9.15 |
Weekly price and volumes for Bed Bath
| Date |
Closing |
Open |
Range |
Volume |
Mon 20 October 2025 |
8.54 (8.51%) |
7.94 |
7.90 - 8.68 |
0.0467 times |
Fri 17 October 2025 |
7.87 (-10.16%) |
8.98 |
7.79 - 9.28 |
0.3053 times |
Fri 10 October 2025 |
8.76 (-27.54%) |
12.14 |
8.75 - 12.23 |
0.2831 times |
Fri 03 October 2025 |
12.09 (28.62%) |
9.45 |
9.05 - 12.65 |
0.3929 times |
Fri 26 September 2025 |
9.40 (-1.26%) |
9.80 |
8.90 - 10.06 |
0.2467 times |
Fri 19 September 2025 |
9.52 (-8.37%) |
10.68 |
9.33 - 10.75 |
0.2532 times |
Fri 12 September 2025 |
10.39 (5.16%) |
10.18 |
9.98 - 11.48 |
0.3808 times |
Fri 05 September 2025 |
9.88 (9.66%) |
8.74 |
8.02 - 9.98 |
0.2321 times |
Fri 29 August 2025 |
9.01 (0%) |
9.58 |
8.86 - 9.78 |
0.0462 times |
Fri 29 August 2025 |
9.01 (8090.91%) |
0.11 |
0.07 - 9.78 |
7.813 times |
Fri 28 April 2023 |
0.11 (-62.07%) |
0.20 |
0.10 - 0.24 |
39.8858 times |
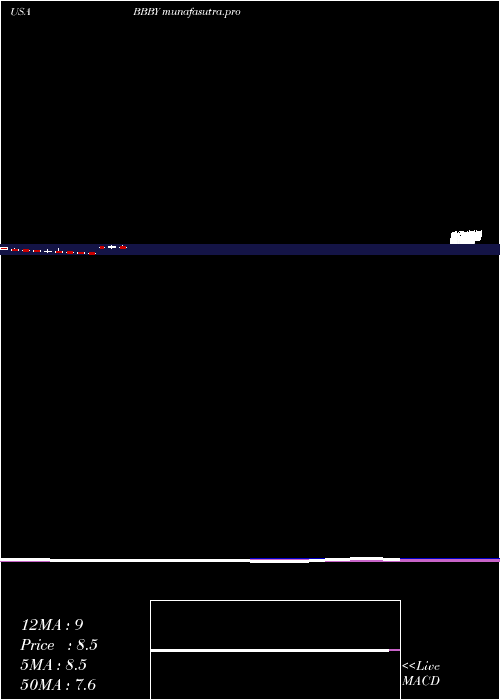
Monthly price and charts BedBath Strong monthly Stock price targets for BedBath BBBY are 5.74 and 10.6 | Monthly Target 1 | 4.8 | | Monthly Target 2 | 6.67 | | Monthly Target 3 | 9.66 | | Monthly Target 4 | 11.53 | | Monthly Target 5 | 14.52 |
Monthly price and volumes Bed Bath
| Date |
Closing |
Open |
Range |
Volume |
Mon 20 October 2025 |
8.54 (-12.77%) |
9.66 |
7.79 - 12.65 |
0.0346 times |
Tue 30 September 2025 |
9.79 (8.66%) |
8.74 |
8.02 - 11.48 |
0.0447 times |
Fri 29 August 2025 |
9.01 (11162.5%) |
9.58 |
8.86 - 9.78 |
0.0034 times |
Tue 02 May 2023 |
0.08 (-27.27%) |
0.11 |
0.07 - 0.12 |
0.2879 times |
Fri 28 April 2023 |
0.11 (-74.42%) |
0.45 |
0.10 - 0.56 |
4.5945 times |
Fri 31 March 2023 |
0.43 (-69.5%) |
1.39 |
0.42 - 1.65 |
1.2571 times |
Tue 28 February 2023 |
1.41 (-50%) |
2.74 |
1.36 - 7.03 |
1.5344 times |
Tue 31 January 2023 |
2.82 (12.35%) |
2.64 |
1.27 - 5.87 |
1.8238 times |
Fri 30 December 2022 |
2.51 (-26.18%) |
3.40 |
2.36 - 4.18 |
0.2034 times |
Wed 30 November 2022 |
3.40 (-25.6%) |
4.70 |
2.96 - 4.78 |
0.216 times |
Mon 31 October 2022 |
4.57 (-24.96%) |
6.05 |
4.26 - 6.69 |
0.2391 times |
DMA SMA EMA moving averages of Bed Bath BBBY
DMA (daily moving average) of Bed Bath BBBY
| DMA period | DMA value | | 5 day DMA | 8.33 | | 12 day DMA | 9.62 | | 20 day DMA | 9.64 | | 35 day DMA | 9.7 | | 50 day DMA | 7.2 | | 100 day DMA | 4.3 | | 150 day DMA | 3.86 | | 200 day DMA | 4.21 | EMA (exponential moving average) of Bed Bath BBBY
| EMA period | EMA current | EMA prev | EMA prev2 | | 5 day EMA | 8.45 | 8.41 | 8.68 | | 12 day EMA | 9.03 | 9.12 | 9.35 | | 20 day EMA | 9.1 | 9.16 | 9.3 | | 35 day EMA | 7.98 | 7.95 | 7.96 | | 50 day EMA | 6.74 | 6.67 | 6.62 |
SMA (simple moving average) of Bed Bath BBBY
| SMA period | SMA current | SMA prev | SMA prev2 | | 5 day SMA | 8.33 | 8.36 | 8.53 | | 12 day SMA | 9.62 | 9.88 | 10.05 | | 20 day SMA | 9.64 | 9.68 | 9.76 | | 35 day SMA | 9.7 | 9.71 | 9.74 | | 50 day SMA | 7.2 | 7.04 | 6.89 | | 100 day SMA | 4.3 | 4.24 | 4.19 | | 150 day SMA | 3.86 | 3.83 | 3.8 | | 200 day SMA | 4.21 | 4.21 | 4.22 |
|
|
